Free Access
Fig. 12
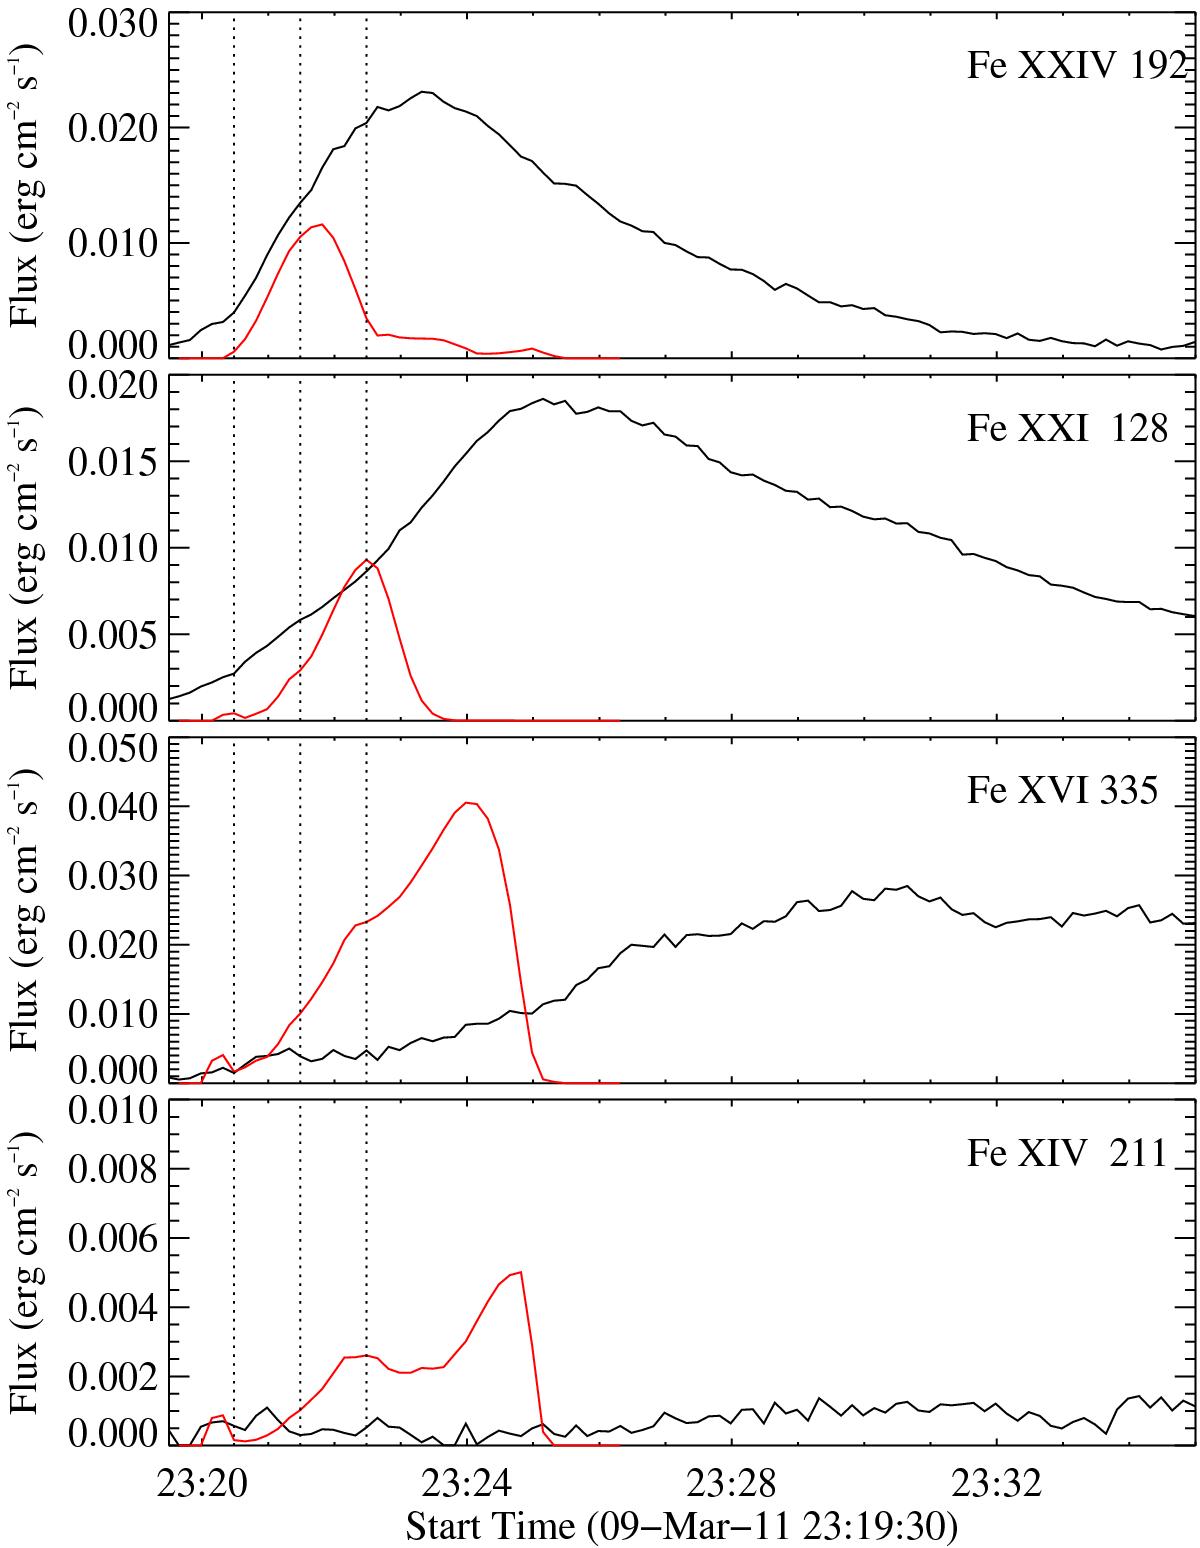
Observed (black) and synthetic (red) light curves of emission lines from Fe ions observed by EVE. The dotted lines indicate the times corresponding to the spectra displayed in Fig. 11.
Current usage metrics show cumulative count of Article Views (full-text article views including HTML views, PDF and ePub downloads, according to the available data) and Abstracts Views on Vision4Press platform.
Data correspond to usage on the plateform after 2015. The current usage metrics is available 48-96 hours after online publication and is updated daily on week days.
Initial download of the metrics may take a while.