Fig. 10
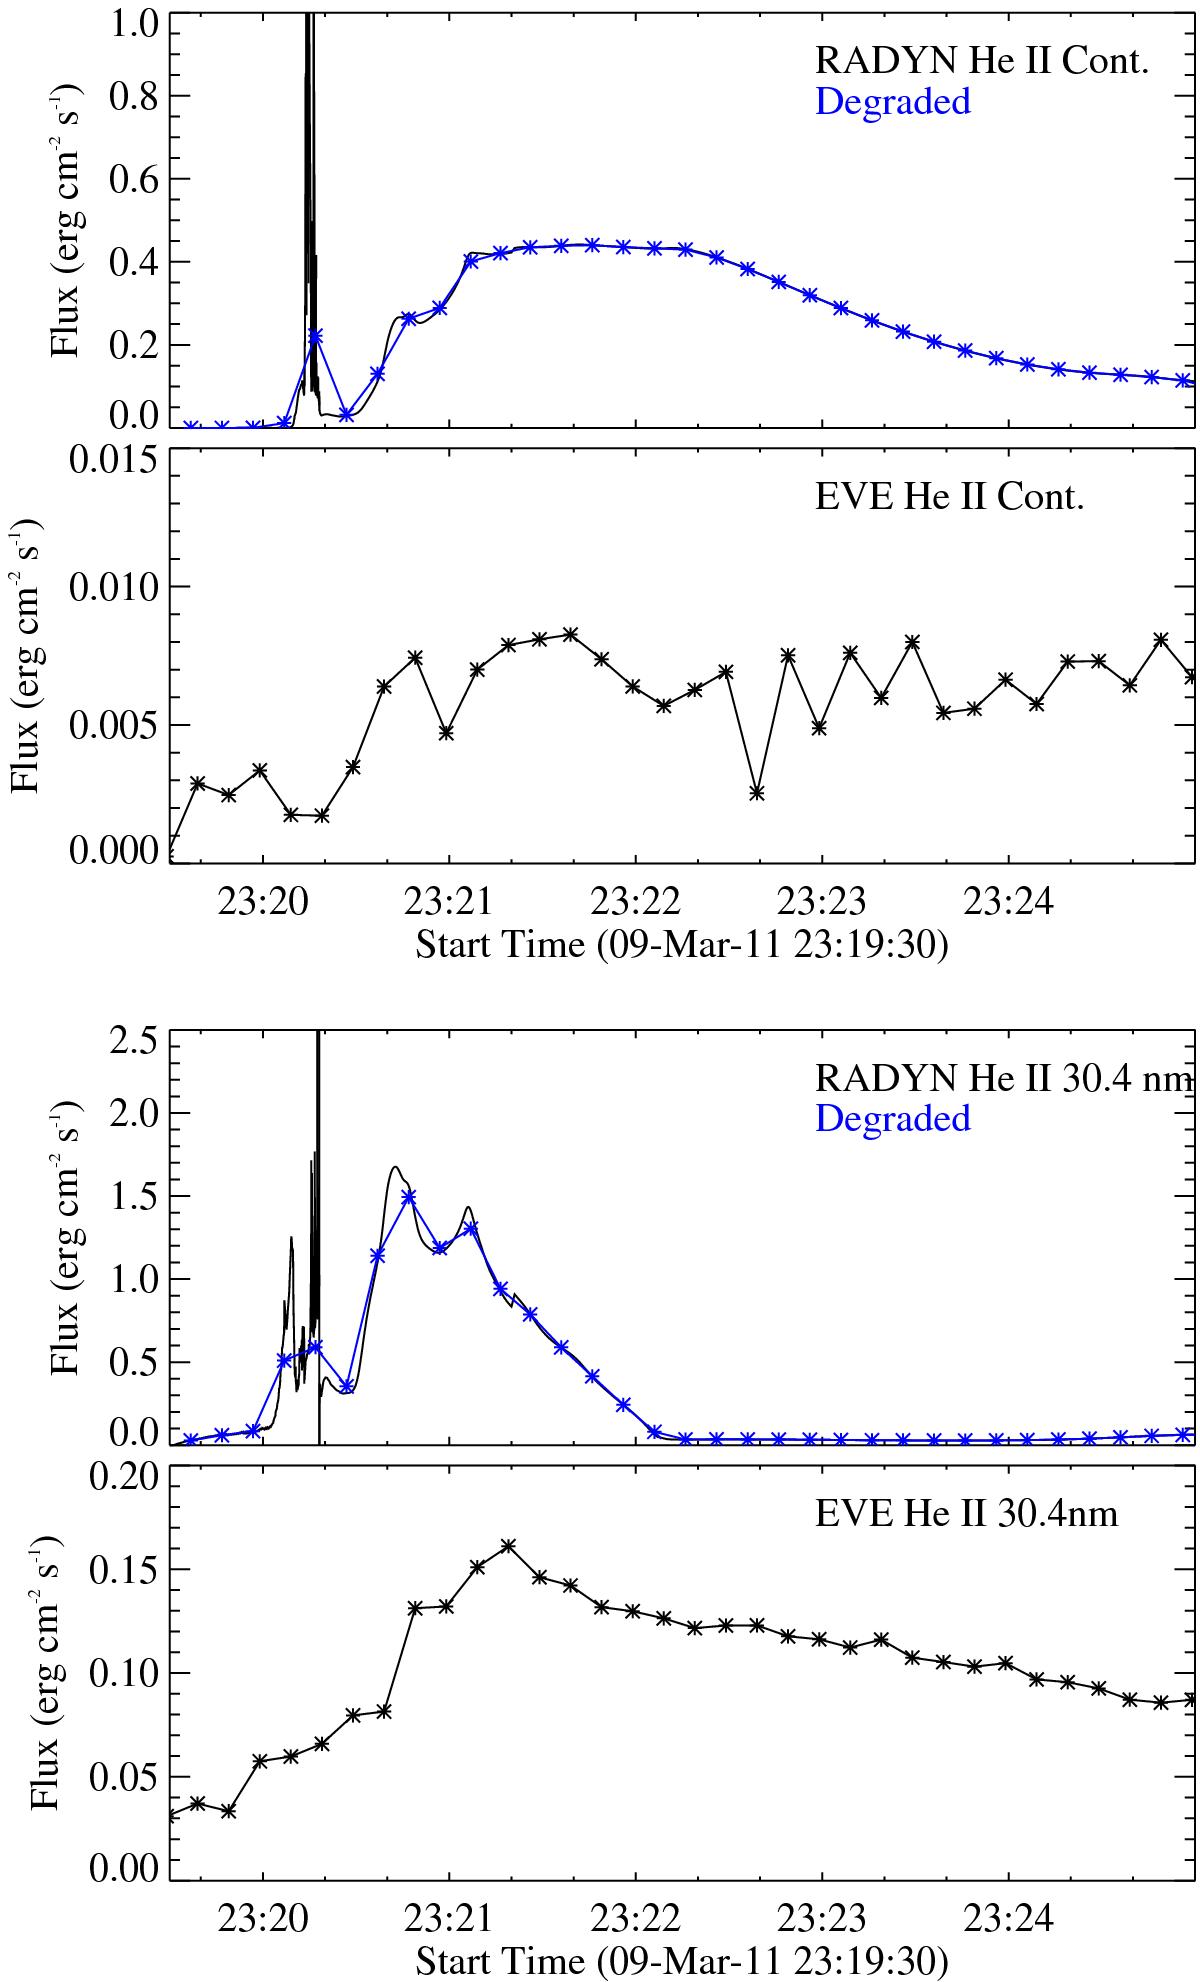
Light curves of He ii recombination and 304 Å line emission created from the RADYN model compared to observed light curves from EVE. The modelled light curves are displayed at each saved time step and then degraded to the instrumental cadence and exposure time of EVE (plotted in blue). The RADYN light curves have been scaled by an estimate of the flare area and converted to the flux measured at Earth to facilitate direct comparison with the observations. The observed light curves from EVE MEGS-A are displayed at 10 s cadence.
Current usage metrics show cumulative count of Article Views (full-text article views including HTML views, PDF and ePub downloads, according to the available data) and Abstracts Views on Vision4Press platform.
Data correspond to usage on the plateform after 2015. The current usage metrics is available 48-96 hours after online publication and is updated daily on week days.
Initial download of the metrics may take a while.