Fig. 8
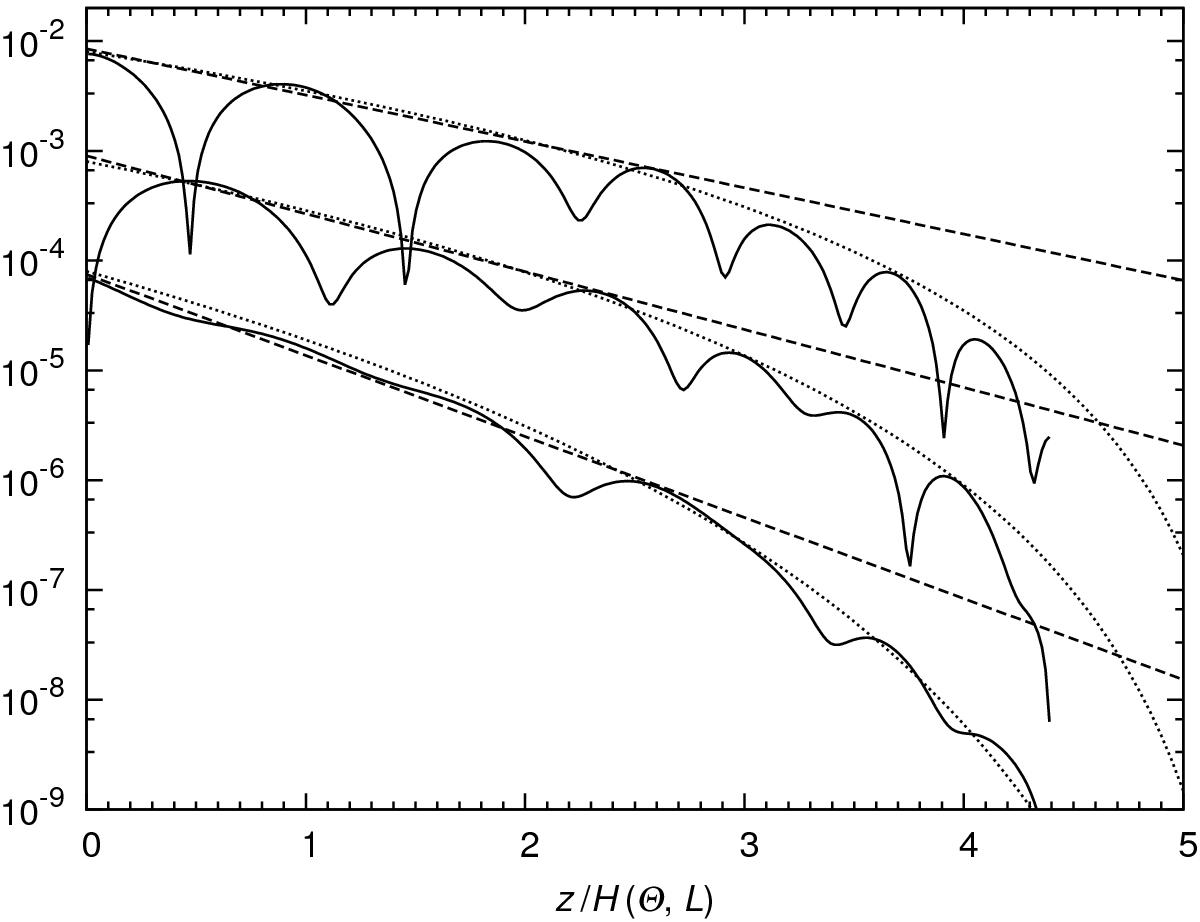
Comparison of the rms velocities and temperature fluctuations in the constant-Re case with two models approximating their global behaviour. Solid lines show urms (top), wrms (middle), and ϑrms (bottom). Dashed lines show the model, in which ue(z) ∝ e− βuz/H, we(z) ∝ e− βwz/H, and ϑe(z) ∝ e− βϑz/H with ![]() ,
, ![]() , and βϑ = 1.7. Dotted lines show the improved model given by Eqs. (52)−(54) with γ = 1.3. The coefficients of proportionality have been adjusted for each variable independently.
, and βϑ = 1.7. Dotted lines show the improved model given by Eqs. (52)−(54) with γ = 1.3. The coefficients of proportionality have been adjusted for each variable independently.
Current usage metrics show cumulative count of Article Views (full-text article views including HTML views, PDF and ePub downloads, according to the available data) and Abstracts Views on Vision4Press platform.
Data correspond to usage on the plateform after 2015. The current usage metrics is available 48-96 hours after online publication and is updated daily on week days.
Initial download of the metrics may take a while.