Fig. 6
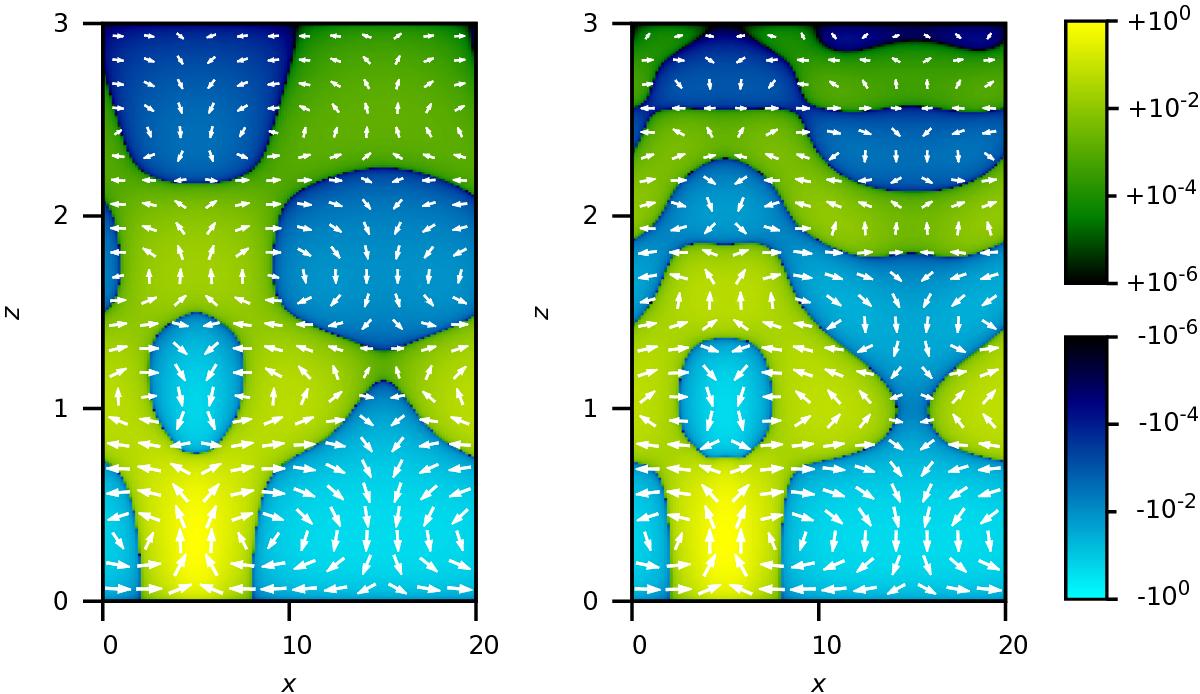
Effect of two different artificial-viscosity prescriptions on the flow structure. The constant-Pr flow (Prx, Prz = const.; left panel) is compared with the constant-Re flow (Prx, Prz ∝ e− 2z; right panel). The vertical velocity component w is in both cases plotted on a split-logarithmic colour scale. The length of the velocity vectors (arrows) is scaled in a non-linear way to aid visualisation.
Current usage metrics show cumulative count of Article Views (full-text article views including HTML views, PDF and ePub downloads, according to the available data) and Abstracts Views on Vision4Press platform.
Data correspond to usage on the plateform after 2015. The current usage metrics is available 48-96 hours after online publication and is updated daily on week days.
Initial download of the metrics may take a while.