Fig. 4
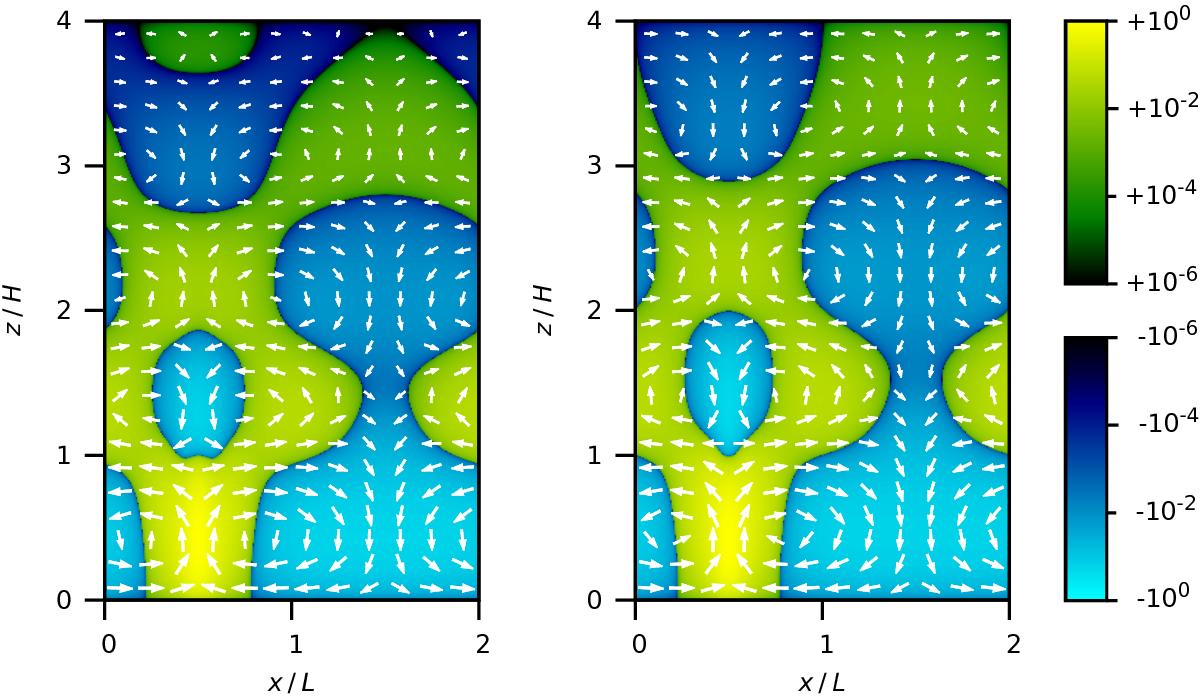
Comparison of the flow structure in two simulations with very disparate heating parameters. The left panel shows simulation sr30 (Θ = 10-3, L = 101). The right panel shows simulation sr03 (Θ = 100, L = 104). In both cases, the vertical velocity component w, normalised to its maximal absolute value, is plotted on a split logarithmic colour scale. The length of the velocity vectors (arrows) is scaled in a non-linear way to aid visualisation. The spatial coordinates are normalised by the characteristic length scales defined in Sects. 2.3 and 3.
Current usage metrics show cumulative count of Article Views (full-text article views including HTML views, PDF and ePub downloads, according to the available data) and Abstracts Views on Vision4Press platform.
Data correspond to usage on the plateform after 2015. The current usage metrics is available 48-96 hours after online publication and is updated daily on week days.
Initial download of the metrics may take a while.