Fig. 2
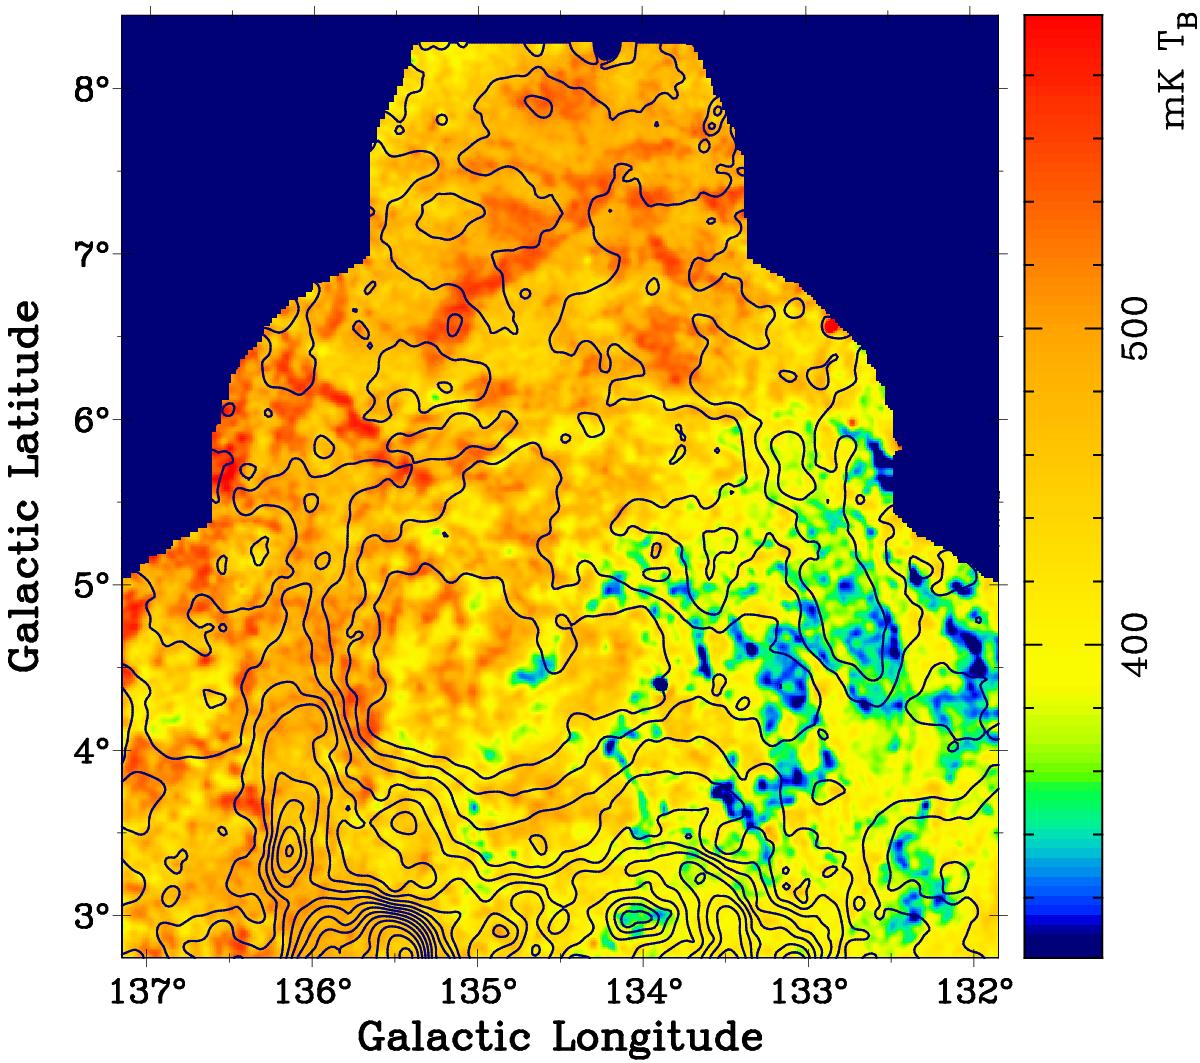
Combined λ21 cm polarized emission of the W4 superbubble with data from the DRAO interferometer, the Effelsberg 100-m, and the DRAO 26-m single-dish telescopes at an angular resolution of 3′. Overlaid λ21 cm contours are from the source subtracted and spatially filtered total intensity map (see text). Contour lines run from 2000 mK Tb in steps of 50 mK Tb.
Current usage metrics show cumulative count of Article Views (full-text article views including HTML views, PDF and ePub downloads, according to the available data) and Abstracts Views on Vision4Press platform.
Data correspond to usage on the plateform after 2015. The current usage metrics is available 48-96 hours after online publication and is updated daily on week days.
Initial download of the metrics may take a while.