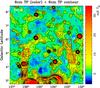
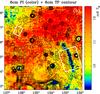
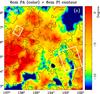
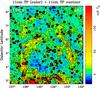
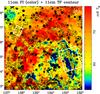
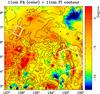
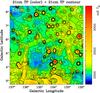
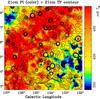
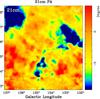
Fig. 1

Total intensity I, polarization intensity PI, and polarization angle PA images of the W4 superbubble at λ6 cm (upper panels a), b), c)), λ11 cm (middle panels d), e), f)), and λ21 cm (bottom panels g), h), i)). The angular resolutions are 9![]() 5 for λ6 cm images in panels a) and b), 4
5 for λ6 cm images in panels a) and b), 4![]() 3 for λ11 cm images in panels d) and e), and 9
3 for λ11 cm images in panels d) and e), and 9![]() 35 for λ21 cm images in panels g), h), and i). The PA images at λ6 cm (panel c)) and λ11 cm (panel f)) have angular resolutions of 12′ and 6′, respectively. The total intensity contours for I and PI images run from 1.8 mK Tb in steps of 2.4 mK Tb for λ6 cm, from 10.0 mK Tb in steps of 12.0 mK Tb for λ11 cm (after subtracting strong point-like sources), and from 2000 mK Tb in steps of 50 mK Tb for λ21 cm. The PI contours on the PA images start from 5.0 mK Tb in steps of 1.0 mK Tb for λ6 cm, and from 50.0 mK Tb in steps of 8.0 mK Tb for λ11 cm. PI contours are not overlaid on the λ21 cm PA image, because no clear correlations can be found. The rectangles in panel a) are the regions for TT-plots study, while the rectangles in panels b), c), and e), f) indicate the regions used for the Faraday screen model fitting.
35 for λ21 cm images in panels g), h), and i). The PA images at λ6 cm (panel c)) and λ11 cm (panel f)) have angular resolutions of 12′ and 6′, respectively. The total intensity contours for I and PI images run from 1.8 mK Tb in steps of 2.4 mK Tb for λ6 cm, from 10.0 mK Tb in steps of 12.0 mK Tb for λ11 cm (after subtracting strong point-like sources), and from 2000 mK Tb in steps of 50 mK Tb for λ21 cm. The PI contours on the PA images start from 5.0 mK Tb in steps of 1.0 mK Tb for λ6 cm, and from 50.0 mK Tb in steps of 8.0 mK Tb for λ11 cm. PI contours are not overlaid on the λ21 cm PA image, because no clear correlations can be found. The rectangles in panel a) are the regions for TT-plots study, while the rectangles in panels b), c), and e), f) indicate the regions used for the Faraday screen model fitting.
Current usage metrics show cumulative count of Article Views (full-text article views including HTML views, PDF and ePub downloads, according to the available data) and Abstracts Views on Vision4Press platform.
Data correspond to usage on the plateform after 2015. The current usage metrics is available 48-96 hours after online publication and is updated daily on week days.
Initial download of the metrics may take a while.