Fig. 6
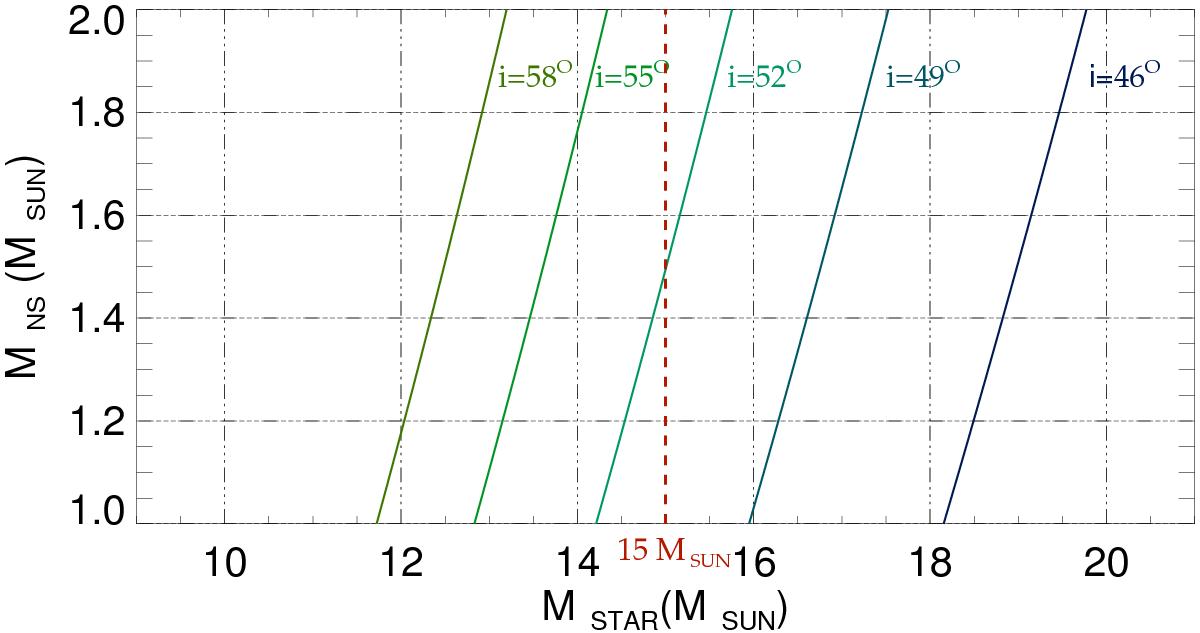
Relations between the donor mass and neutron star mass. Lines of constant orbital inclination constructed from the mass function of Levine et al. (2004) are labelled. The X-axis range corresponds to the spectroscopic mass error margin, while the Y-axis range covers the range permitted for a neutron star mass (e.g. Lattimer 2012).
Current usage metrics show cumulative count of Article Views (full-text article views including HTML views, PDF and ePub downloads, according to the available data) and Abstracts Views on Vision4Press platform.
Data correspond to usage on the plateform after 2015. The current usage metrics is available 48-96 hours after online publication and is updated daily on week days.
Initial download of the metrics may take a while.