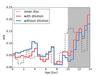
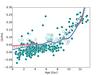
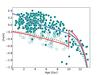
Fig. 9
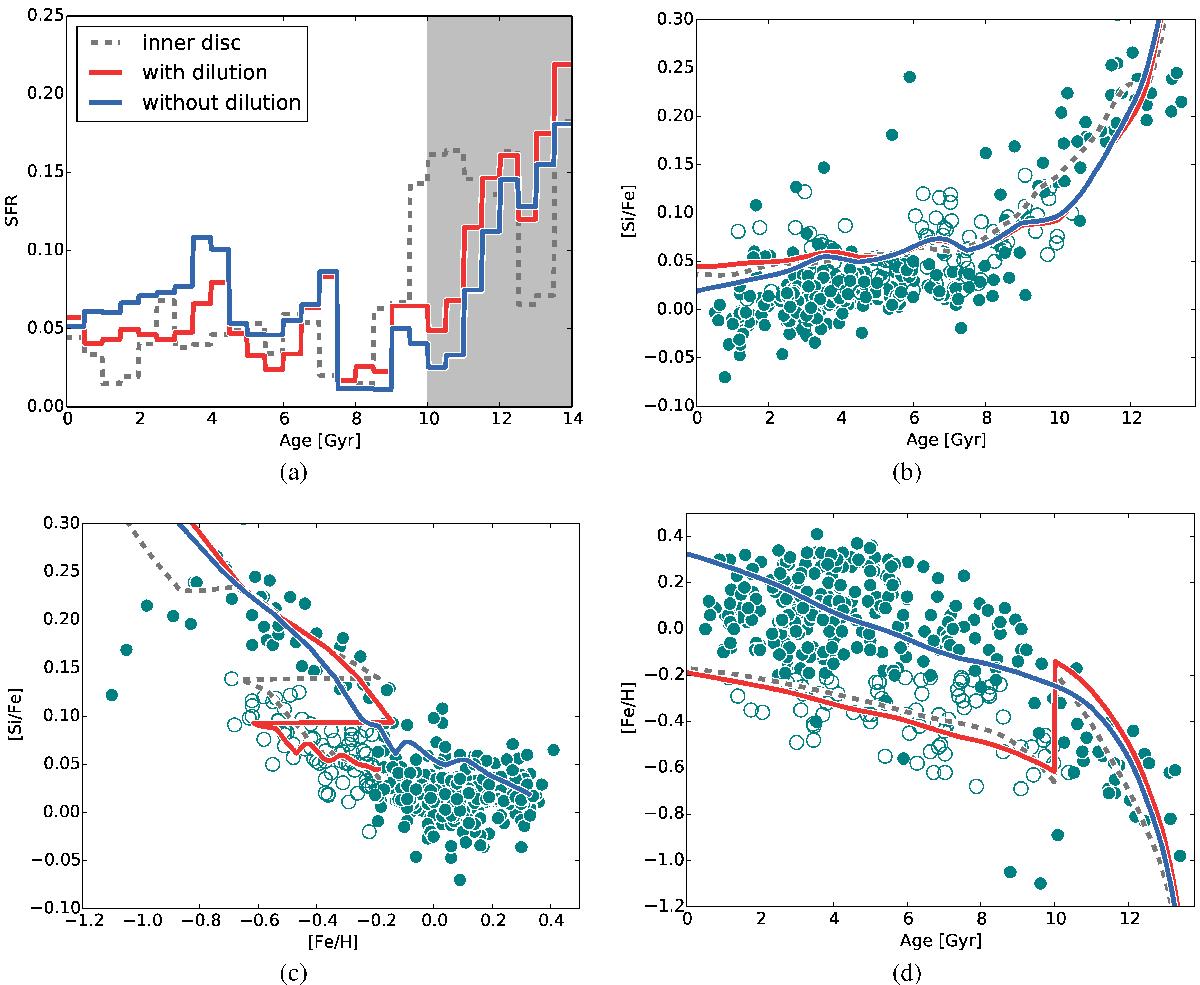
Chemical evolution of the best-fit SFH to the outer disc, using silicon and the meteoric solar abundances from Anders & Grevesse (1989). The blue line is the best fit to the outer disc stars using the standard model, while the red line is the chemical track where the amount of hydrogen in the ISM is increased by 3 (the dilution model). The grey line is for the best-fit line from the inner stars (Fig. 7) using the dilution model. The grey region in panel a) depicts the ages before the outer disc begins to form and is, therefore, essentially unconstrained. All three curves are the results of the mean of the bootstrapping method used in the previous subsection. Panels b)−d) are the [Si/Fe]-age, [Si/Fe]-metallicity and metallicity-age tracks of the model and the corresponding data. The outer disc data are given as empty circles, while the inner disc is shown as filled circles.
Current usage metrics show cumulative count of Article Views (full-text article views including HTML views, PDF and ePub downloads, according to the available data) and Abstracts Views on Vision4Press platform.
Data correspond to usage on the plateform after 2015. The current usage metrics is available 48-96 hours after online publication and is updated daily on week days.
Initial download of the metrics may take a while.