Free Access
Fig. 8
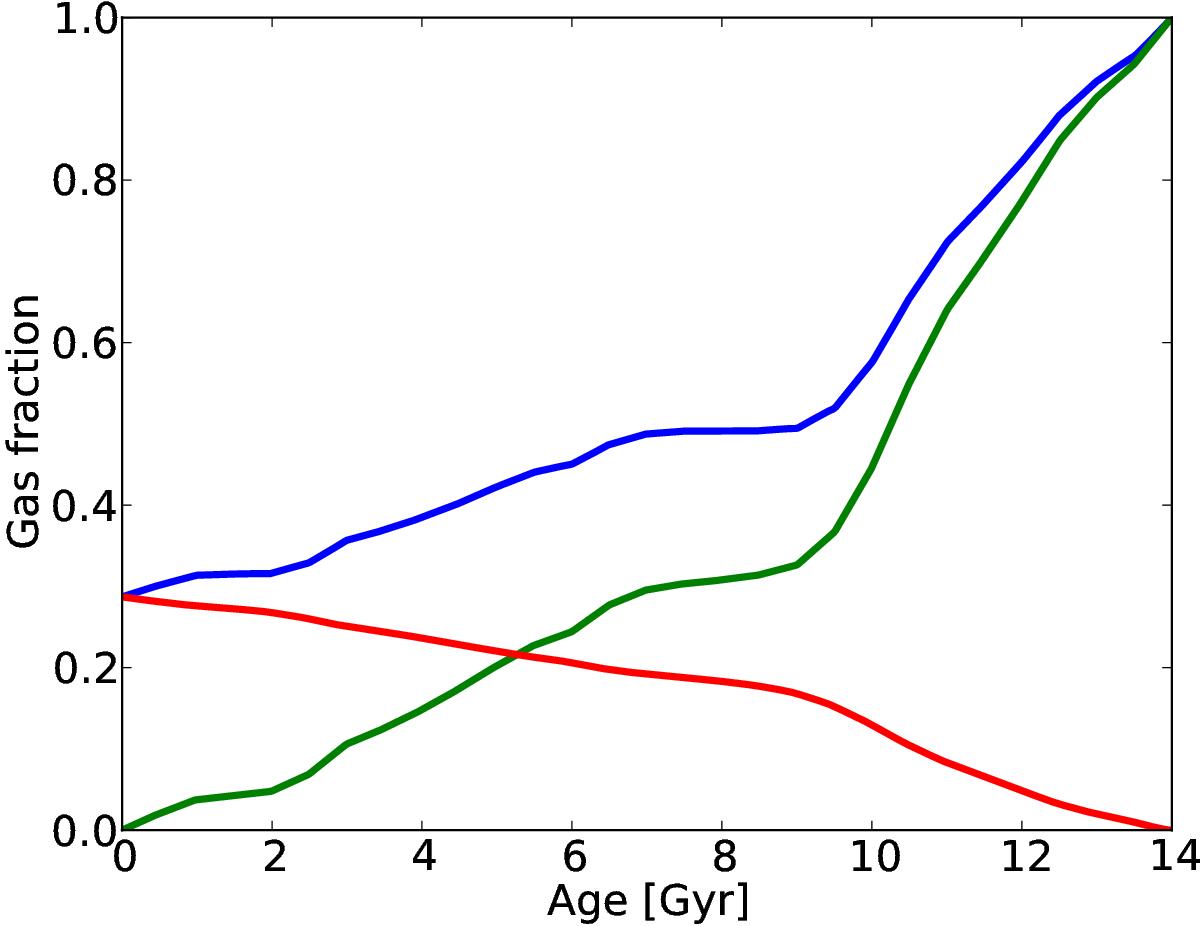
Evolution of the gas fraction with time resulting from the mean SFH given in Fig. 7. The blue line is the net fraction of gas in the system with time, the red line shows the fraction of recycled gas from stars, while the green line shows the evolution of gas fraction in the absence of gas recycling.
Current usage metrics show cumulative count of Article Views (full-text article views including HTML views, PDF and ePub downloads, according to the available data) and Abstracts Views on Vision4Press platform.
Data correspond to usage on the plateform after 2015. The current usage metrics is available 48-96 hours after online publication and is updated daily on week days.
Initial download of the metrics may take a while.