Fig. 7
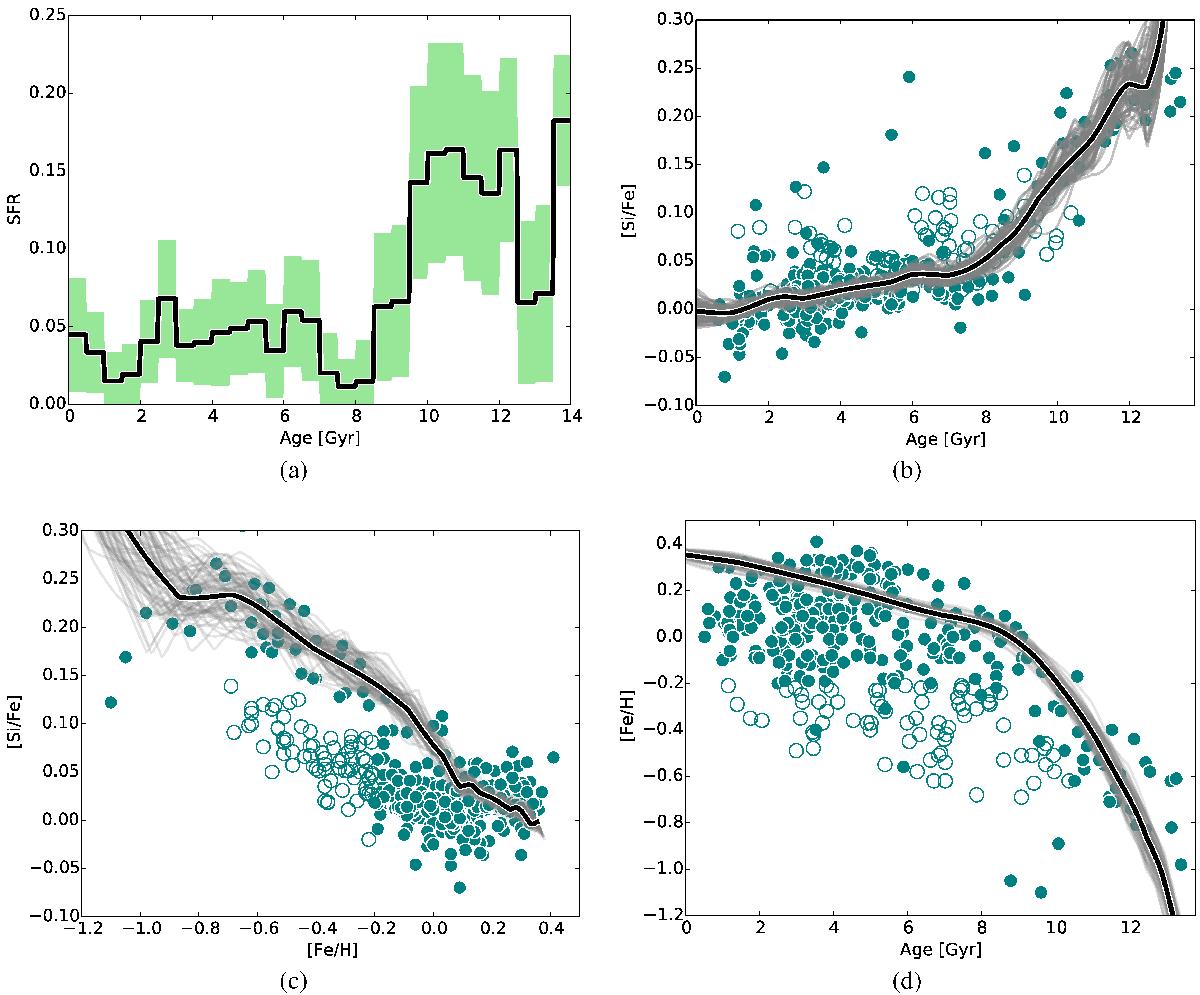
Chemical evolution of the best-fit SFH for silicon of the inner disc using the solar abundances of Anders & Grevesse (1989). The grey lines are the results of the various bootstrapped best-fit SFHs, the black line is the mean value. Filled circles are the inner disc stars, empty circles are the outer disc from Haywood et al. (2013). In panel a) the green region is the standard deviation on the values in each bin. These values are not independent and the variance in the total SFH is considerably smaller than in each individual bin. Panels a)−d) show the best-fit SFH, the evolution of [Si/Fe] with age, the evolution of [Si/Fe] with metallicity, and the evolution of the metallicity with age.

Current usage metrics show cumulative count of Article Views (full-text article views including HTML views, PDF and ePub downloads, according to the available data) and Abstracts Views on Vision4Press platform.
Data correspond to usage on the plateform after 2015. The current usage metrics is available 48-96 hours after online publication and is updated daily on week days.
Initial download of the metrics may take a while.