Free Access
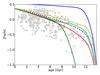
Fig. 6
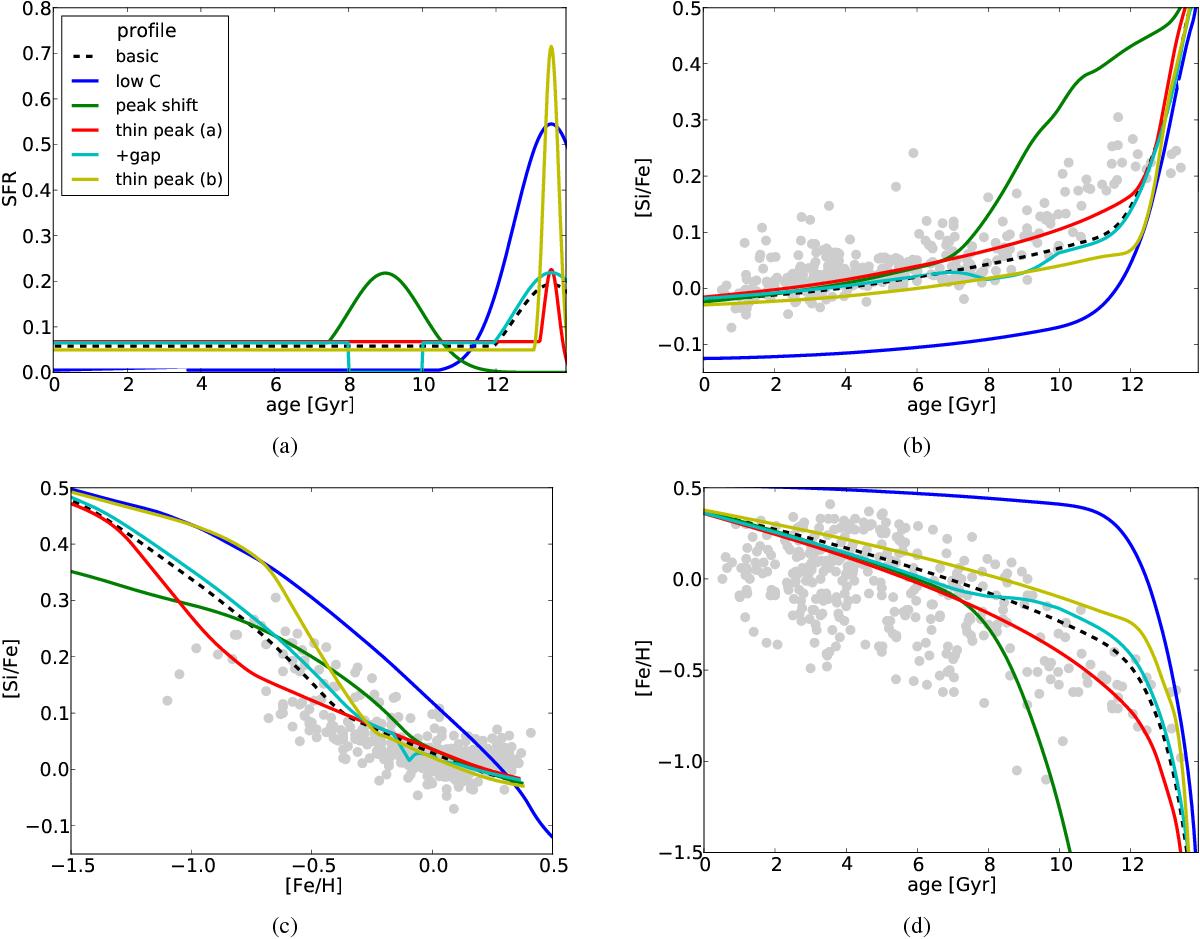
Chemical evolution of the model depending upon a selection of different SFHs (panel a), Table 1). Panels b), c) and d) show the evolution of [Si/Fe] with age, [Si/Fe] with metallicity, and the metallicity with age. The grey points are the data from Haywood et al. (2013), including inner and outer disc stars.
This figure is made of several images, please see below:
Current usage metrics show cumulative count of Article Views (full-text article views including HTML views, PDF and ePub downloads, according to the available data) and Abstracts Views on Vision4Press platform.
Data correspond to usage on the plateform after 2015. The current usage metrics is available 48-96 hours after online publication and is updated daily on week days.
Initial download of the metrics may take a while.