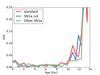
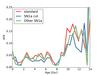
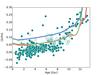
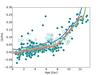
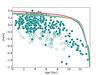
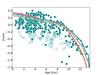
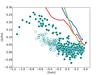
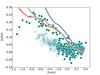
Fig. 18

Comparison of three different models and yields. The left-hand column shows the best-fit chemical tracks for SNII yields from Woosley & Weaver (1995), while the right hand column shows the tracks for SNII yields from Nomoto et al. (2006). The best-fit chemical track and recovered SFH for the standard GCE model summarised in Table 2 is the “standard” track (red line). The blue and green lines are the chemical tracks where a threshold (Z = 0.1 Z⊙) for activating SNIa is included (“the SN1a cut”), and an alternative set of SNIa yields from Travaglio et al. (2004) are used (“Other SN1a”). The recovered SFHs are given in panels a) and b), and the standard distributions age-[Si/Fe], age-[Fe/H] and [Fe/H]-[Si/Fe] are given in rows two to four. The points are adapted from Haywood et al. (2013). Open circles are outer thin-disc stars, solid circles are thick-disc and inner thin-disc stars.
Current usage metrics show cumulative count of Article Views (full-text article views including HTML views, PDF and ePub downloads, according to the available data) and Abstracts Views on Vision4Press platform.
Data correspond to usage on the plateform after 2015. The current usage metrics is available 48-96 hours after online publication and is updated daily on week days.
Initial download of the metrics may take a while.