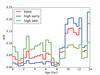
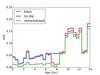
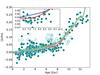
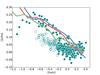
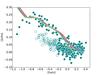
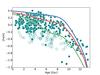
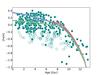
Fig. 10
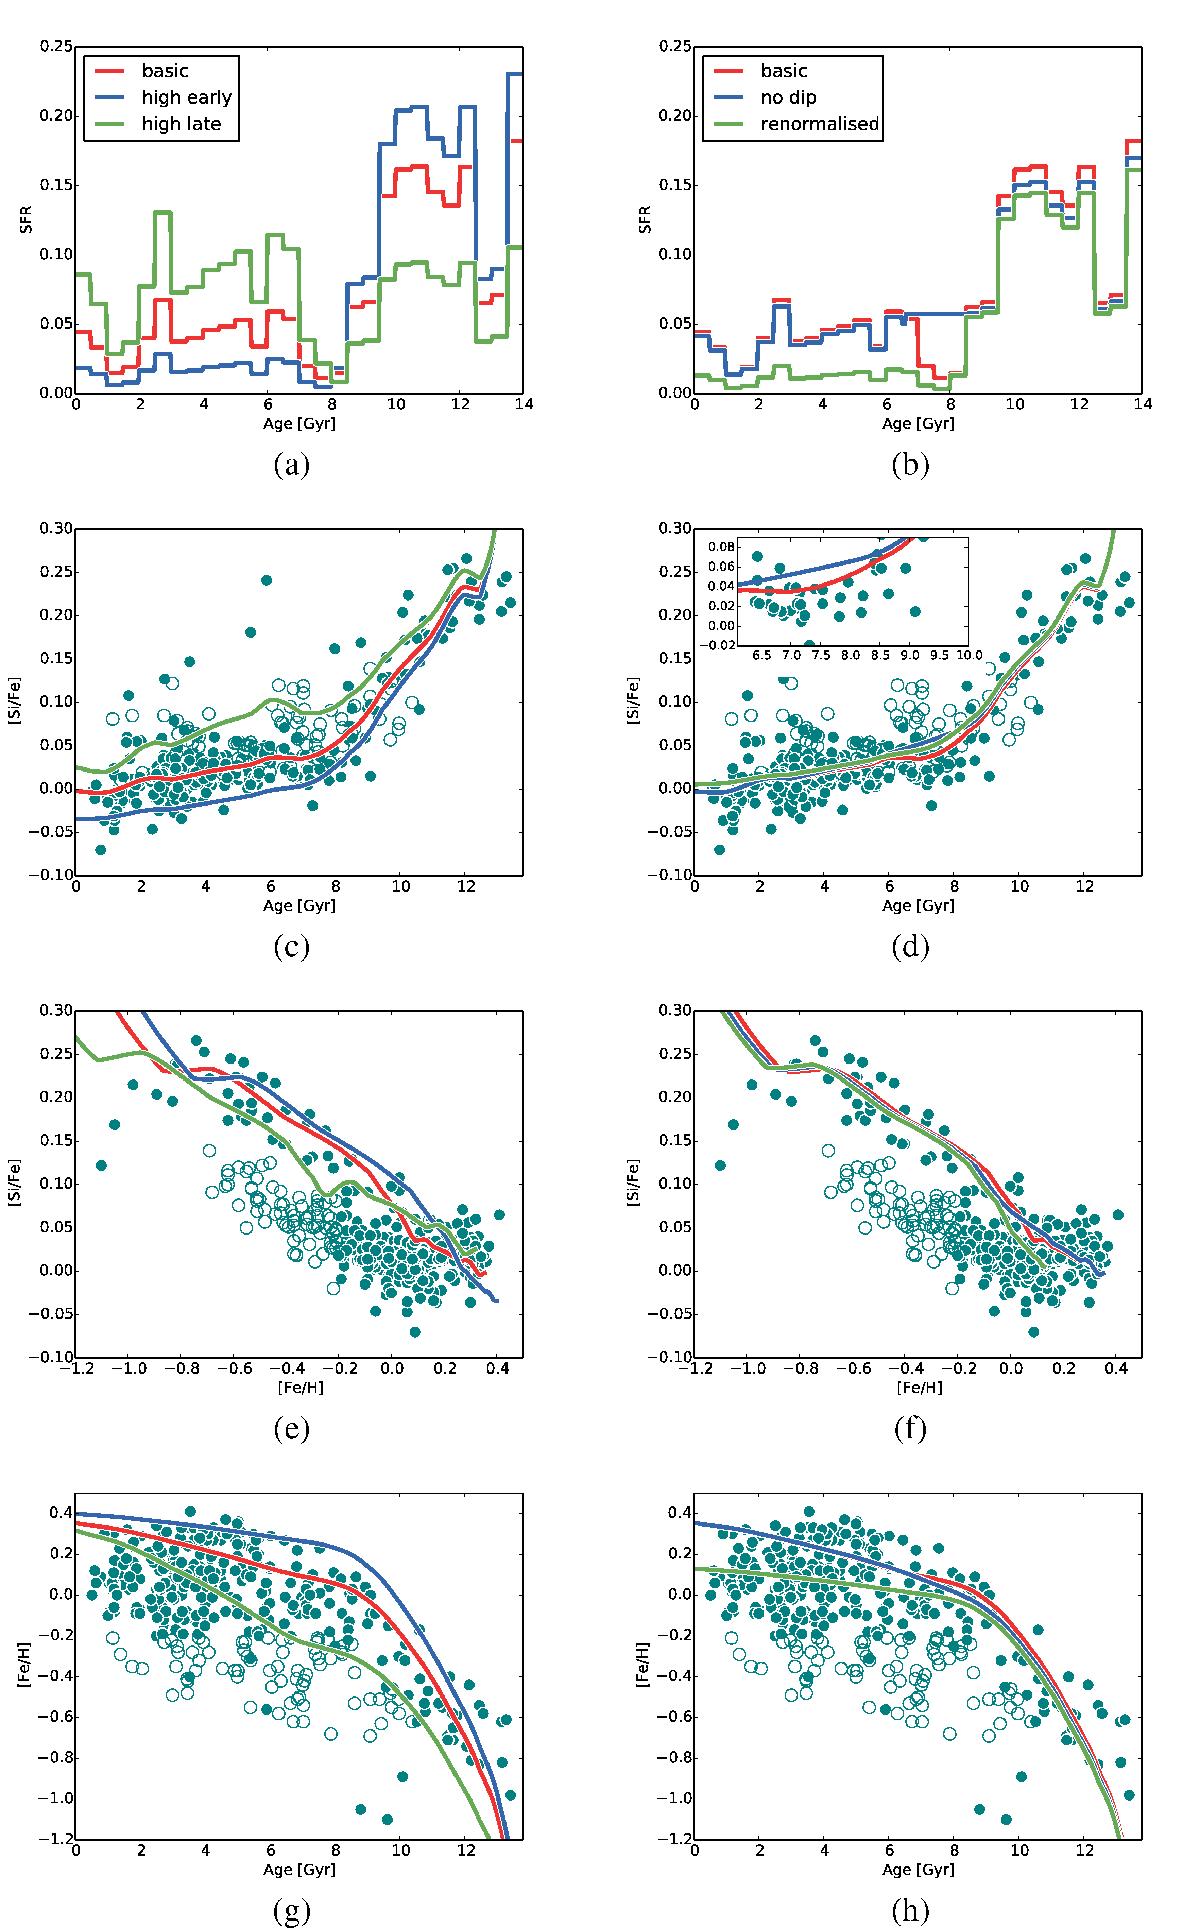
Effect of alterations to the best-fit SFH on the chemical evolution of the model. Panels a) and b) illustrate the modifications to the SFR from Fig. 7. The subsequent rows are the age-[Si/Fe], [Fe/H]-[Si/Fe] and age-[Fe/H] projections. The particular case of the green SFH in the right-hand column is what happens if we reduce the SFH normalisation (A in Eq. (13)) to 0.7. The blue line is the SFH without the dip at 8 Gyr. In all plots the red line is the best-fit SFH found for the inner disc stars (from Fig. 7). The outer disc data are given as empty circles, while the inner disc is shown as filled circles. The inset in panel d) emphasizes the effect of removing the dip (green line) from the SFH compared to the basic SFH (blue line) and only shows the inner disc data.
Current usage metrics show cumulative count of Article Views (full-text article views including HTML views, PDF and ePub downloads, according to the available data) and Abstracts Views on Vision4Press platform.
Data correspond to usage on the plateform after 2015. The current usage metrics is available 48-96 hours after online publication and is updated daily on week days.
Initial download of the metrics may take a while.