Fig. 7
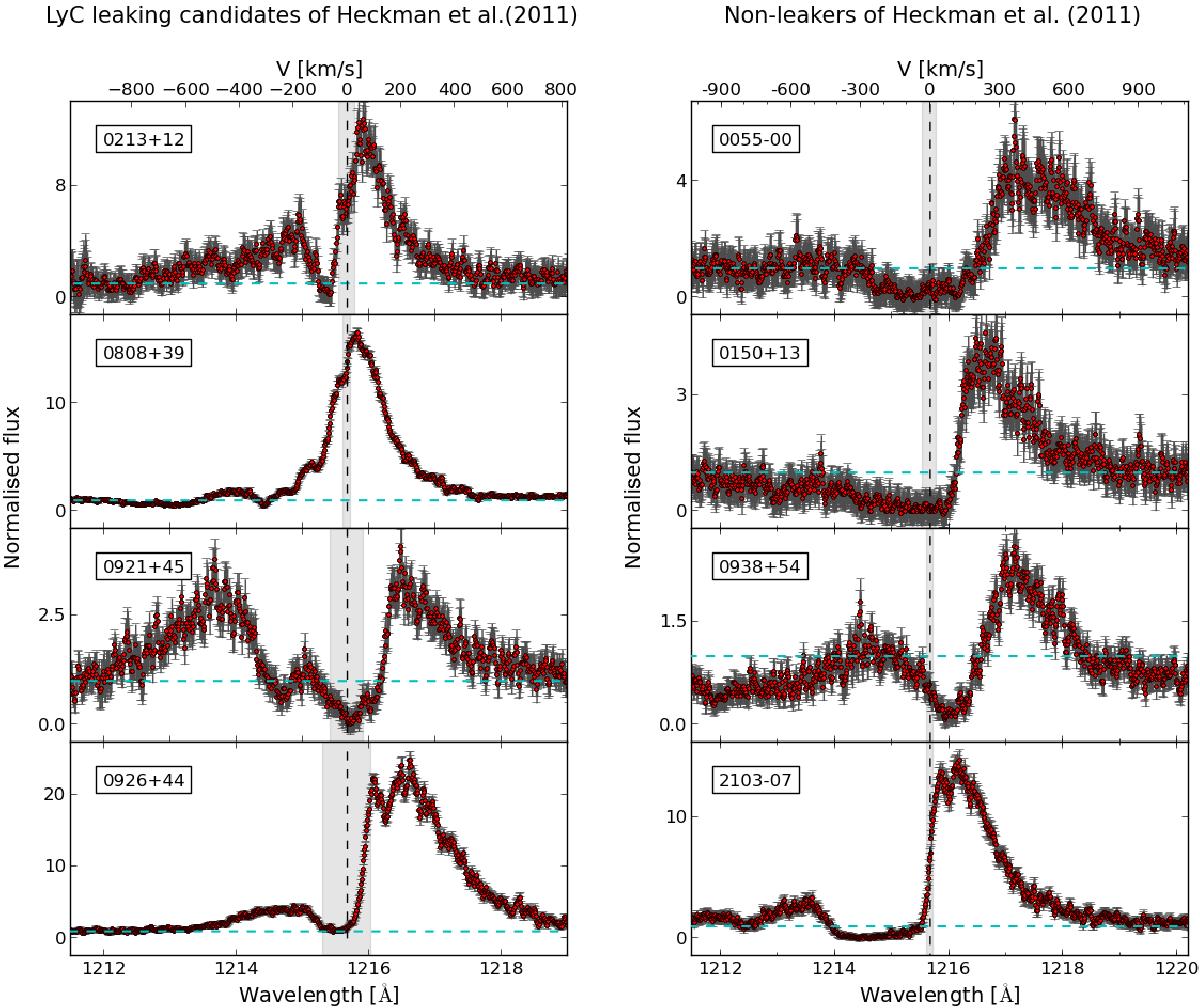
Lyα profiles of LyC leaking (left) vs. non-leaking candidates (right) from the sample of Heckman et al. (2011). The data have been smoothed to the nominal COS resolution (i.e. R = 20 000 for a point source). The systemic redshifts and their errors (grey shaded area in each plot) were derived from SDSS emission lines. The blue horizontal line denotes the continuum level. The signal-to-noise differences across the sample reflect both the redshifts and the intrinsic properties of the galaxies as Lyα sources.
Current usage metrics show cumulative count of Article Views (full-text article views including HTML views, PDF and ePub downloads, according to the available data) and Abstracts Views on Vision4Press platform.
Data correspond to usage on the plateform after 2015. The current usage metrics is available 48-96 hours after online publication and is updated daily on week days.
Initial download of the metrics may take a while.