Fig. 2
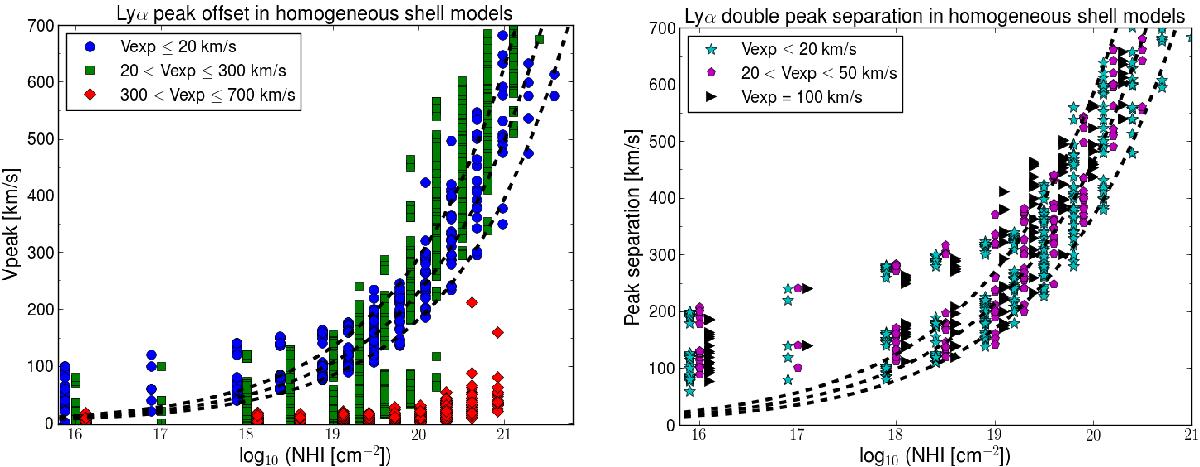
Correlation between the Lyα peak positions and the neutral gas column density as measured in the grid of McLya radiation transfer models in spherical homogeneous shells (Verhamme et al. 2006; Schaerer et al. 2011). Left: Lyα peak offset vpeak. We colour-code three ranges of the outflow velocity: static models in blue, moderate outflow velocity models in green, high-velocity wind models in red. Right: separation Speak of peaks in the double-peak Lyα profiles, i.e. those resulting from Lyα radiative transfer in low-velocity outflows (the profiles become single-peaked for velocities higher than 100 km s-1). The black curves in both panels depict the analytically derived Lyα peak positions for radiative transfer in a static uniform sphere (Dijkstra et al. 2006). From top to bottom, they correspond to b = 40 km s-1, b = 20 km s-1 and b = 10 km s-1. Some discrepancy between the analytical estimate of Vpeak and the numerical experiment is expected at the low NHI end, since the analytical solution is only valid in an optically thick regime (see for example Fig. 2 in Verhamme et al. 2006). We checked that these results are independent of instrumental resolution.
Current usage metrics show cumulative count of Article Views (full-text article views including HTML views, PDF and ePub downloads, according to the available data) and Abstracts Views on Vision4Press platform.
Data correspond to usage on the plateform after 2015. The current usage metrics is available 48-96 hours after online publication and is updated daily on week days.
Initial download of the metrics may take a while.