Fig. 1
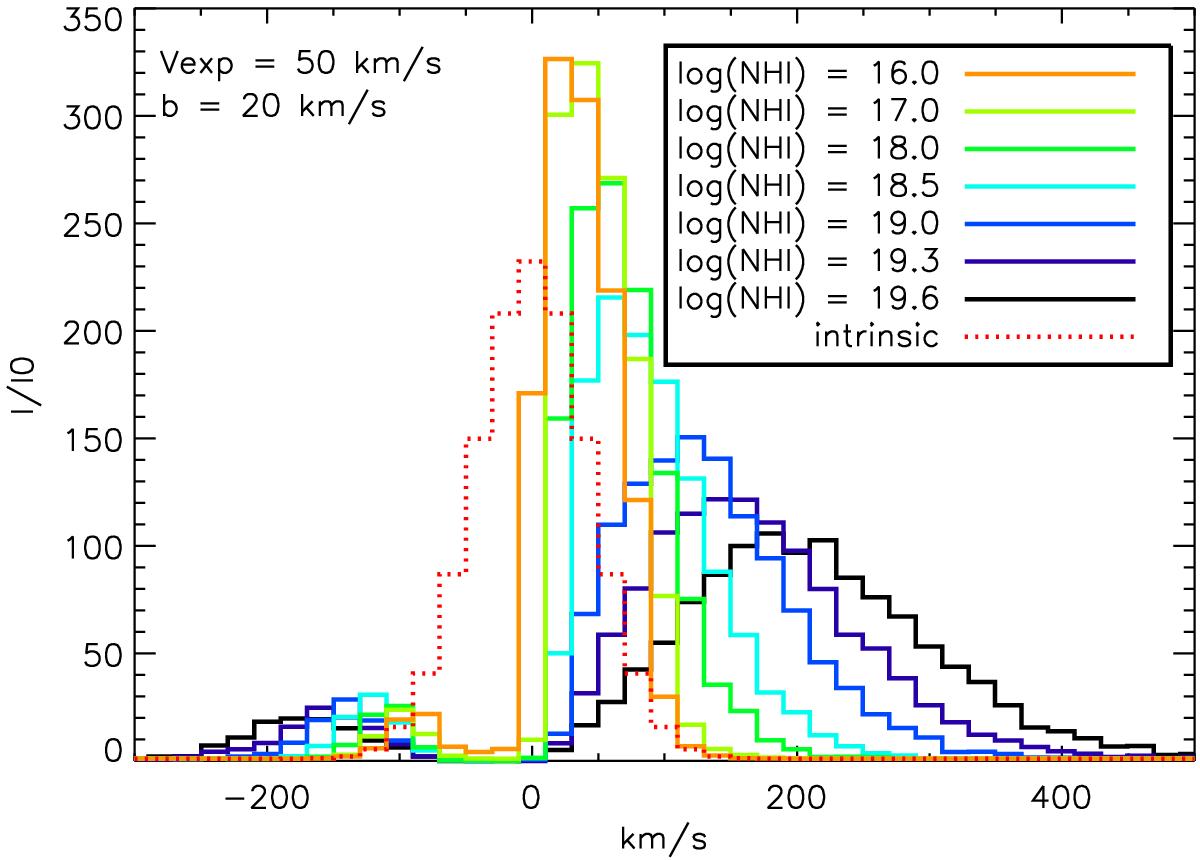
Spectra emerging from starbursts with neutral column densities ranging from the LyC optically thin regime (NHI ≤ 1017 cm-2) to NHI = 1019.6 cm-2, as an illustration of the line broadening with increasing optical depth. The models are dust free, with an expansion velocity vexp = 50 km s-1, and a Doppler parameter b = 20 km s-1. The intrinsic spectrum is a flat continuum plus a Gaussian emission line of FWHM = 100 km s-1 and EW = 100 Å. These spectra are not convolved to account for a finite instrumental resolution, but they would correspond to extremely high-resolution spectra (R ≥ 15 000 or Δv ≤ 20 km s-1). In this plot and in the following theoretical spectra, the notation I/I0 indicates that the profiles are normalised to the flux level in the continuum, I0, which is the mean number of escaping photons per frequency bin over an arbitrary frequency range far from line centre, here xr = [−3000 km s-1; −2000 km s-1].
Current usage metrics show cumulative count of Article Views (full-text article views including HTML views, PDF and ePub downloads, according to the available data) and Abstracts Views on Vision4Press platform.
Data correspond to usage on the plateform after 2015. The current usage metrics is available 48-96 hours after online publication and is updated daily on week days.
Initial download of the metrics may take a while.