Fig. 3
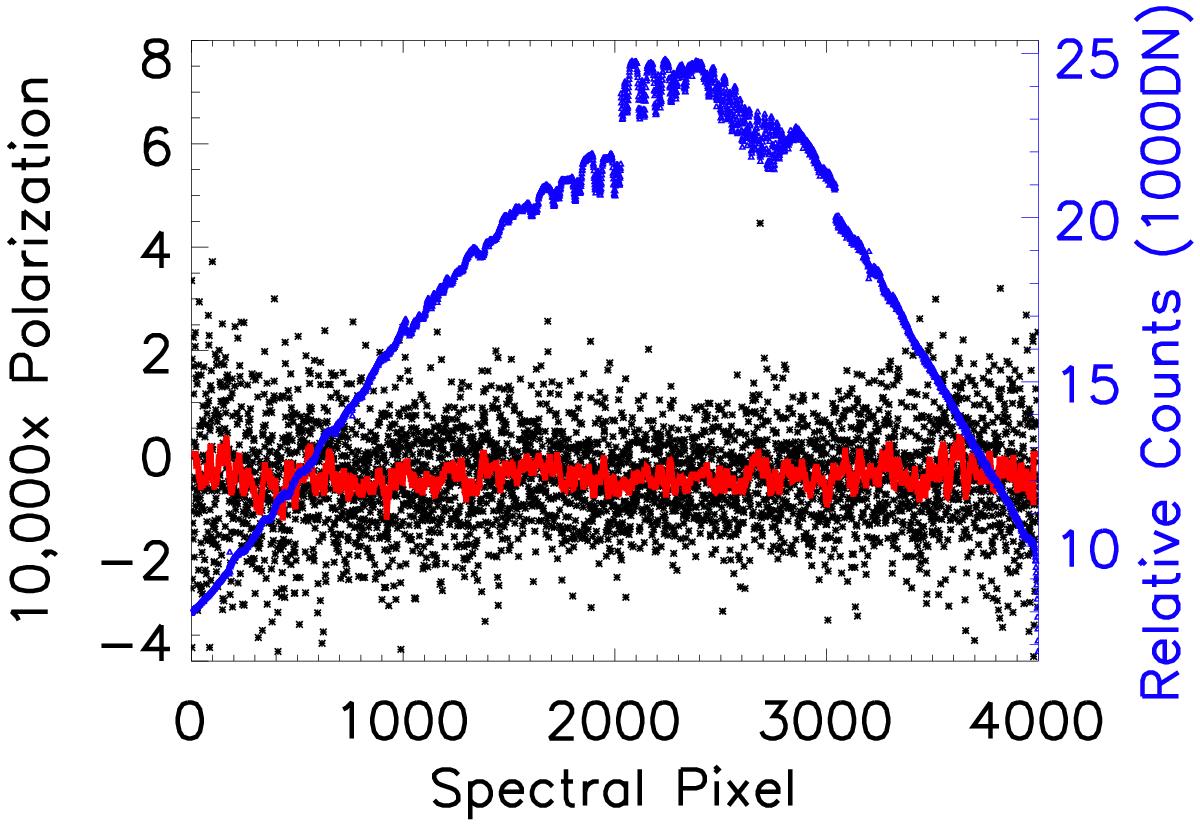
Flat field lamp intensity spectrum (blue) and polarization errors (black and red) for a single spectral order. We show the data at our nominal 12 000 spectral resolution and R = 100 000 spectral sampling. The right-hand y axis shows the intensity spectrum in detected counts per exposure. The intensity spectrum in blue shows a strong blaze function intensity variation across the order along with the typical CCD mosaic gaps and pedestal offsets. The two CCDs in the mosaic each have two amplifiers with slightly varying gains and biases. The intensity was left uncalibrated to illustrate these CCD effects. Spectral features from the lamp and atmosphere are seen in the middle of the spectrum. The left-hand y axis shows the polarization spectrum multiplied by 10 000. Amplifier and CCD gaps are not visible in the polarization spectrum. The computed polarization is dominated by shot noise below the 0.01% level at full spectral sampling. The rms of the polarization spectrum is substantially decreased by averaging adjacent spectral pixels, as seen in the red curve. This averaging shows that photon statistics are the dominant noise source. See text for details.
Current usage metrics show cumulative count of Article Views (full-text article views including HTML views, PDF and ePub downloads, according to the available data) and Abstracts Views on Vision4Press platform.
Data correspond to usage on the plateform after 2015. The current usage metrics is available 48-96 hours after online publication and is updated daily on week days.
Initial download of the metrics may take a while.