Fig. A.1
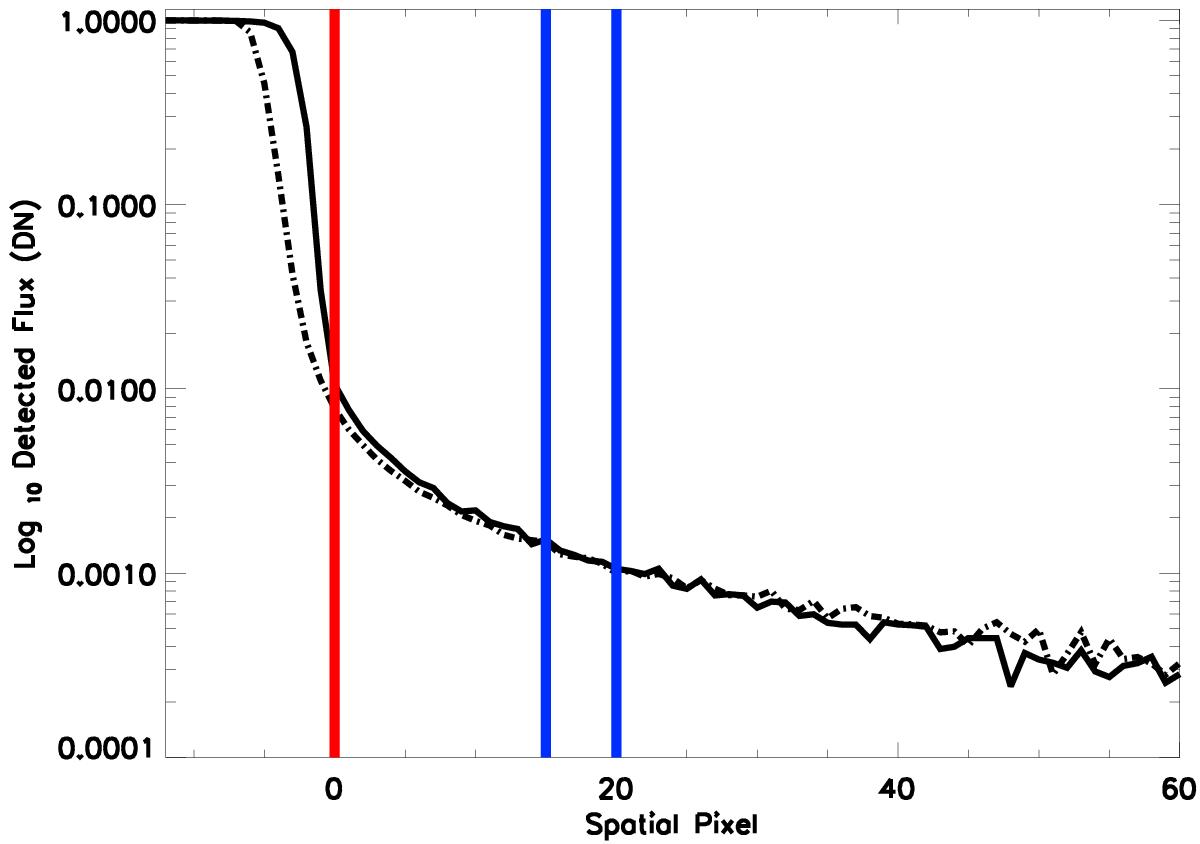
Spatial profile delivered for the spectrograph in the LoVIS configuration with the flat-field lamp (April 26th 2011). There were no polarimetric components present in the beam. The spatial profile is shown on a log scale. The red vertical line shows the edge of the extracted spectrum typically set in our data reduction pipeline. The blue lines show the region typically used to compute the background (dark, bias and scattered light) extraction.
Current usage metrics show cumulative count of Article Views (full-text article views including HTML views, PDF and ePub downloads, according to the available data) and Abstracts Views on Vision4Press platform.
Data correspond to usage on the plateform after 2015. The current usage metrics is available 48-96 hours after online publication and is updated daily on week days.
Initial download of the metrics may take a while.