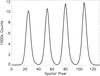
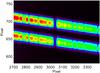
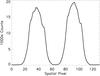
Fig. 2
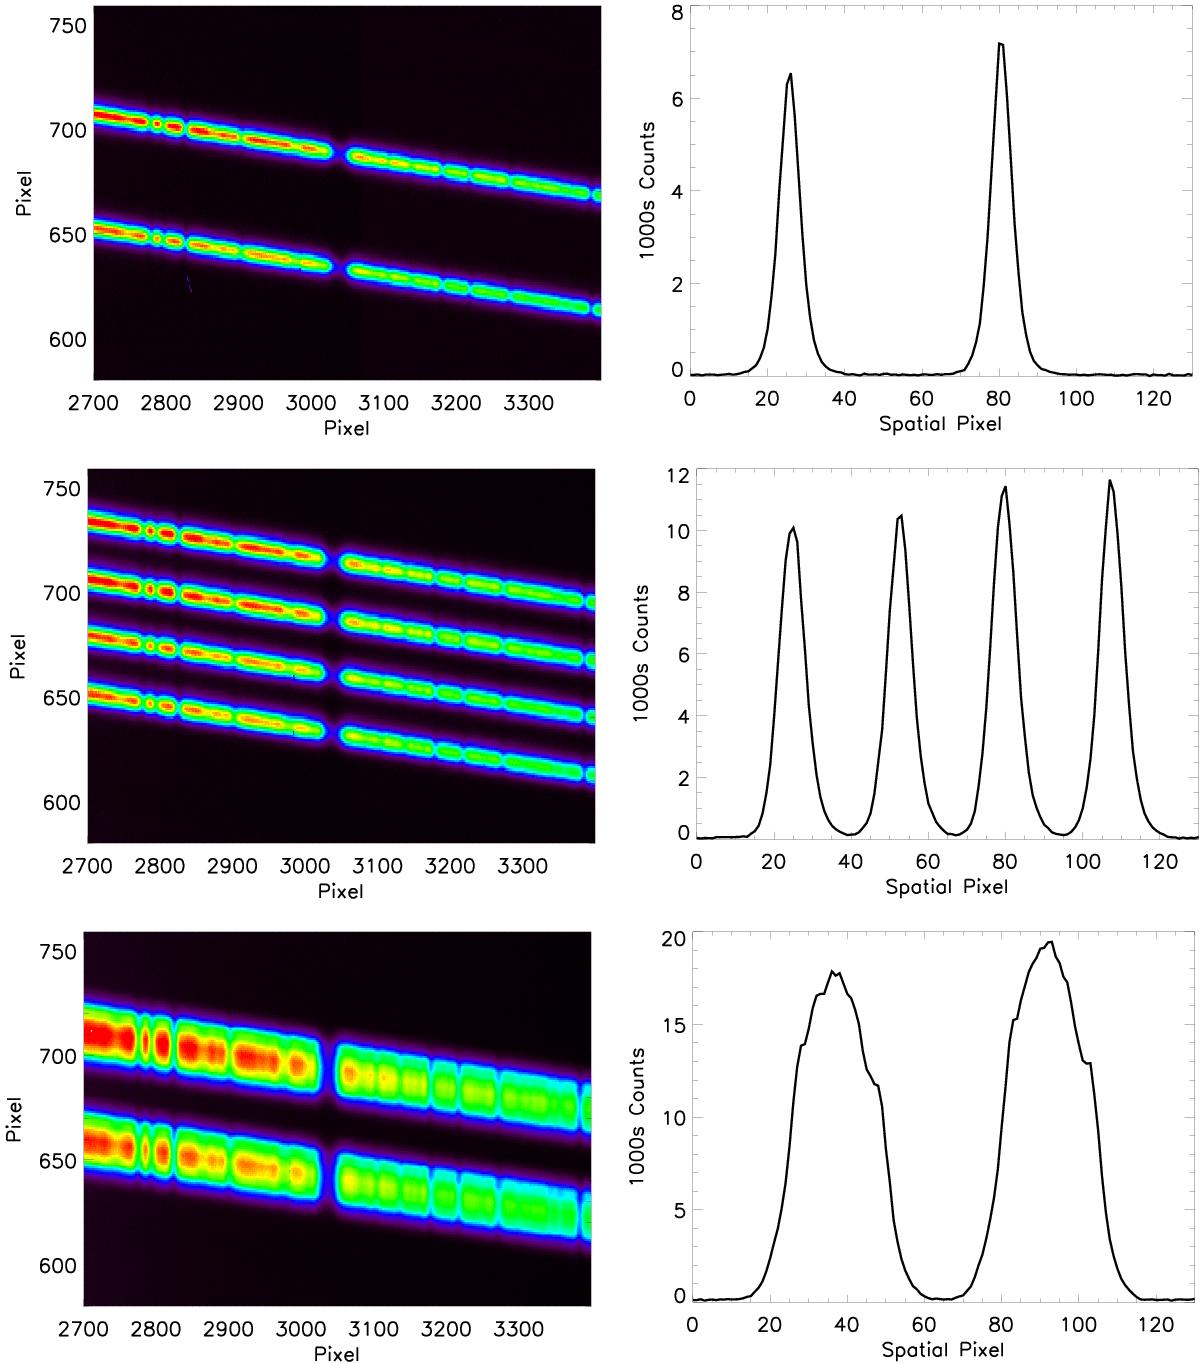
Examples of data delivered by the different modes available to HiVIS users. Each row shows a different observing mode. The left column shows a small portion of a single exposure with the wavelength direction as generally horizontal and the spatial direction as vertical. The normal dual-beam polarimetric mode is shown in the top row. Two orthogonally polarized orders are imaged on the CCD. The corresponding spatial profiles are computed as a spectral average in the spatial direction across an order. The spatial profile is shown on the top right. Two beams are seen with a FHWM of roughly 10 pixels. The Savart plate analyzer separates the two orthogonally polarized beams by roughly 54 pixels aligned with the spatial direction of the spectral orders. The dekker is set to a slit length less than half this displacement in the spatial direction. The liquid-crystal charge-shuffled mode is shown in the middle row. The two distinct liquid crystal modulation settings are inter-woven in 4 beams recorded in a single exposure. We use a charge-shuffling distance of 27 spatial pixels, half of the Savart plate beam displacement. Two beams are stored for one modulation state in non-illuminated buffer pixels while the photoelectrons are accumulated for the second liquid crystal modulation state. Four beams are recorded using two illuminated spectral regions and adjacent non-illuminated buffer regions. The smear-mode is shown in the bottom row. The accumulating charge packet from both orthogonally polarized beams is slowly shuffled to near-by non-illuminated rows as the exposure progresses. This effectively increases the full-well capacity of the image and increases the saturation limit of the detector.
Current usage metrics show cumulative count of Article Views (full-text article views including HTML views, PDF and ePub downloads, according to the available data) and Abstracts Views on Vision4Press platform.
Data correspond to usage on the plateform after 2015. The current usage metrics is available 48-96 hours after online publication and is updated daily on week days.
Initial download of the metrics may take a while.