Fig. 14
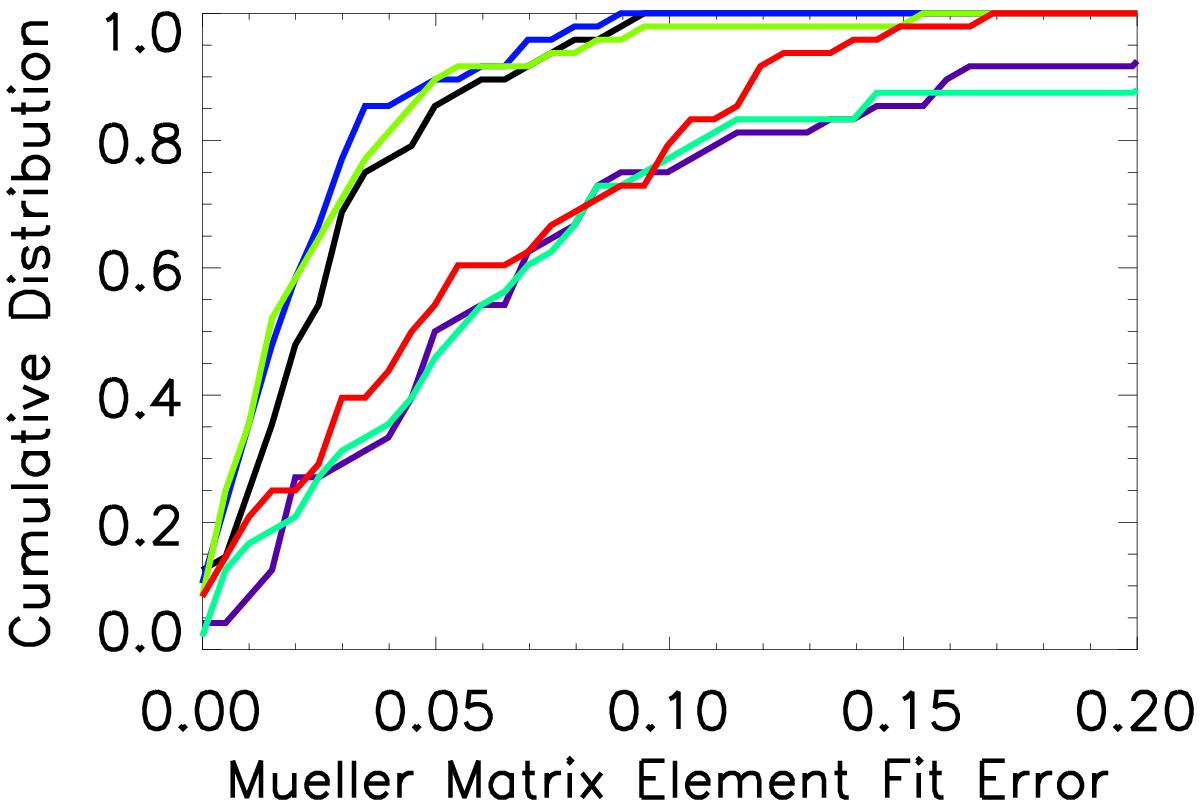
Cumulative error distribution functions when fitting rotation matrix functions of azimuth and elevation to the individual mueller matrix elements. The distribution is based on the difference between the best-fit rotation matrix and each individual least-squares based Mueller matrix estimate at every measured azimuth and elevation. Each color corresponds to one of the six Mueller matrix estimates computed using our daytime sky method. The 68% confidence interval falls between errors of 0.04 for some elements and 0.10 for other elements.
Current usage metrics show cumulative count of Article Views (full-text article views including HTML views, PDF and ePub downloads, according to the available data) and Abstracts Views on Vision4Press platform.
Data correspond to usage on the plateform after 2015. The current usage metrics is available 48-96 hours after online publication and is updated daily on week days.
Initial download of the metrics may take a while.