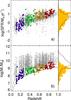
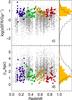
Fig. 7

Redshift distributions of SFR a), stellar mass b), specific SFR c), and HST-ACS I-band half-light radii d). Symbols and colors are the same as in Fig. 3. The normalized distribution of EELGs (filled) and SFGs (black) for each property are shown in the histograms to the right of the panels. Solid, dashed, and dotted lines in b) show the logarithmic fitting to the limiting masses of the star-forming sample for levels 25%, 50%, and 75% of completeness, respectively. The EELGs are small galaxies forming the low end of stellar mass and the high end of sSFR distributions of SFGs in zCOSMOS up to z ~ 1.
Current usage metrics show cumulative count of Article Views (full-text article views including HTML views, PDF and ePub downloads, according to the available data) and Abstracts Views on Vision4Press platform.
Data correspond to usage on the plateform after 2015. The current usage metrics is available 48-96 hours after online publication and is updated daily on week days.
Initial download of the metrics may take a while.