Fig. 10

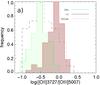
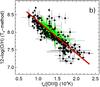
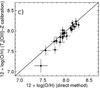
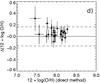
a) Histogram distributions of the ionization parameter, estimated with the [O ii]/[O iii] ratio, for EELGs, green peas (GPs), and Hii galaxies. b) Relation between the oxygen abundance derived from the direct method and the [O iii] electron temperature, te[O iii], for the sample of giant Hii regions and nearby Hii galaxies from Pérez-Montero & Contini (2009, black points) and the sample of GPs from Amorín et al. (2010, green points). The red line indicates the best-fit to the data shown in Eq. (1). c) Comparison between the metallicity derived using the direct method and from the te[O iii] −Z calibration shown in Eq. (1) and their residuals d). Dashed lines in d) indicate the 2σ limits.
Current usage metrics show cumulative count of Article Views (full-text article views including HTML views, PDF and ePub downloads, according to the available data) and Abstracts Views on Vision4Press platform.
Data correspond to usage on the plateform after 2015. The current usage metrics is available 48-96 hours after online publication and is updated daily on week days.
Initial download of the metrics may take a while.