Open Access
Fig. 3
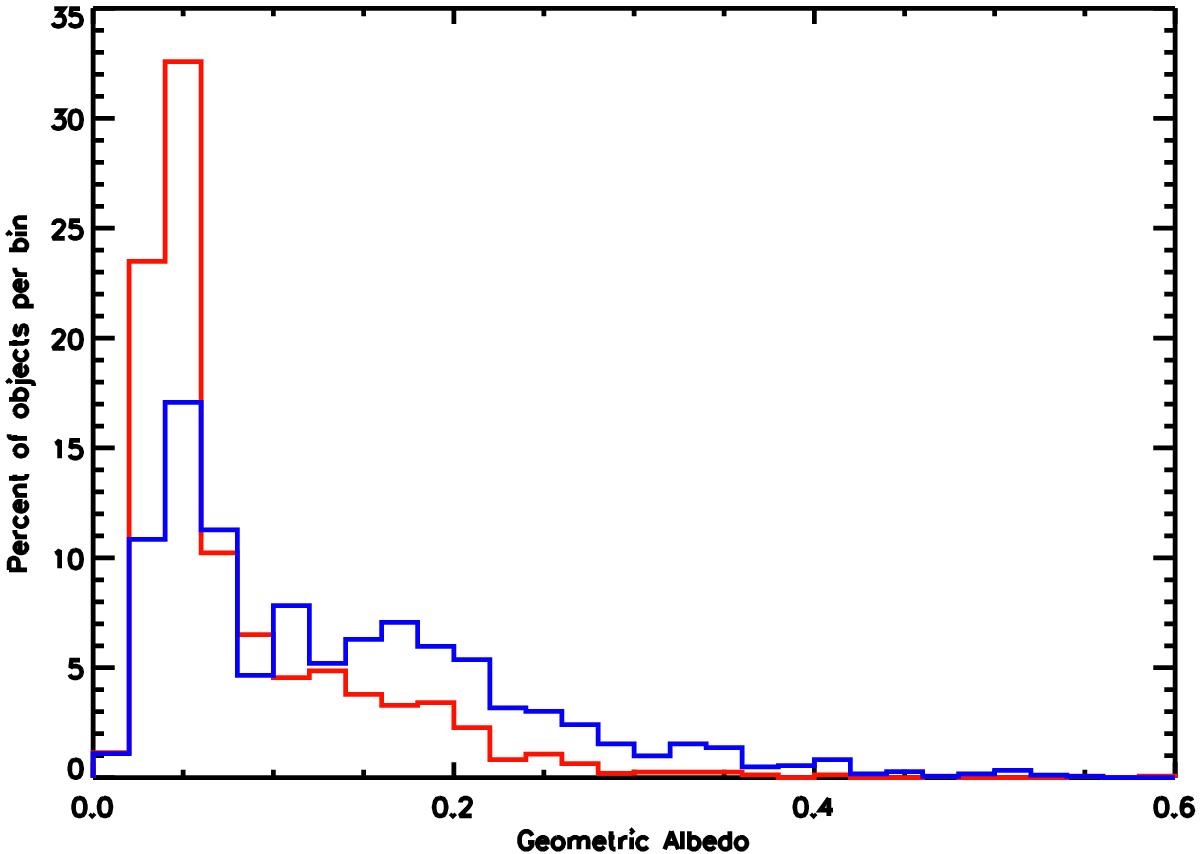
Albedo distribution for asteroids in the IRAS and MSX catalogs of Ryan & Woodward (2010) plotted in red and the albedo distribution for small Main Belt asteroids from the MIPSGAL and Taurus surveys shown in blue. The y-axis is percent of the total sample in each bin – addition of all y-values will equal 100.
Current usage metrics show cumulative count of Article Views (full-text article views including HTML views, PDF and ePub downloads, according to the available data) and Abstracts Views on Vision4Press platform.
Data correspond to usage on the plateform after 2015. The current usage metrics is available 48-96 hours after online publication and is updated daily on week days.
Initial download of the metrics may take a while.