Fig. 2
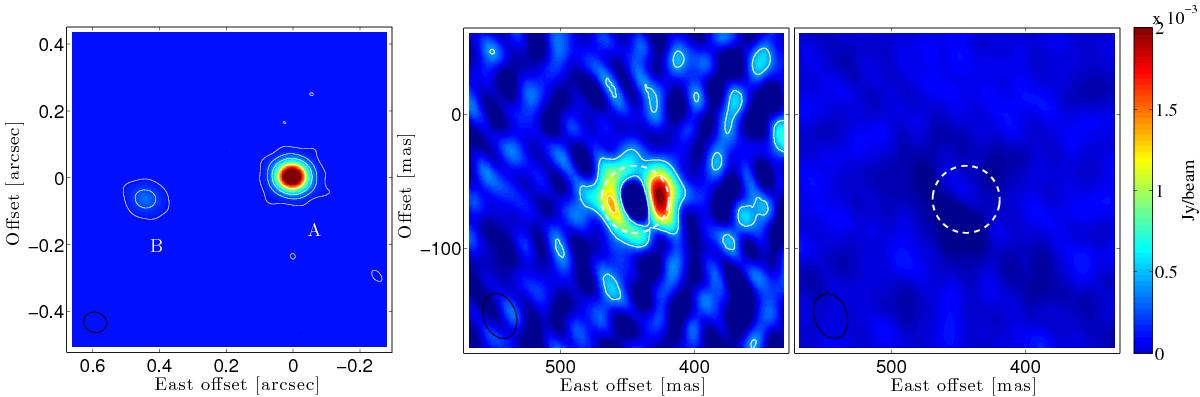
Continuum image of the Mira AB binary at Band 3 (left). Residuals are shown for Band 6 at the location of Mira B after subtracting the best fit delta function (middle) and extended Gaussian (right). The dashed circle indicates the FWHM of the fitted Gaussian. Contours in all three plots are drawn at 3,30,90,270,810σ with σ = 40 μJy beam-1 in Band 3 and σ = 140 μJy beam-1 in Band 6. The beam size is shown in the bottom left of all three figures.
Current usage metrics show cumulative count of Article Views (full-text article views including HTML views, PDF and ePub downloads, according to the available data) and Abstracts Views on Vision4Press platform.
Data correspond to usage on the plateform after 2015. The current usage metrics is available 48-96 hours after online publication and is updated daily on week days.
Initial download of the metrics may take a while.