Free Access
Fig. 3
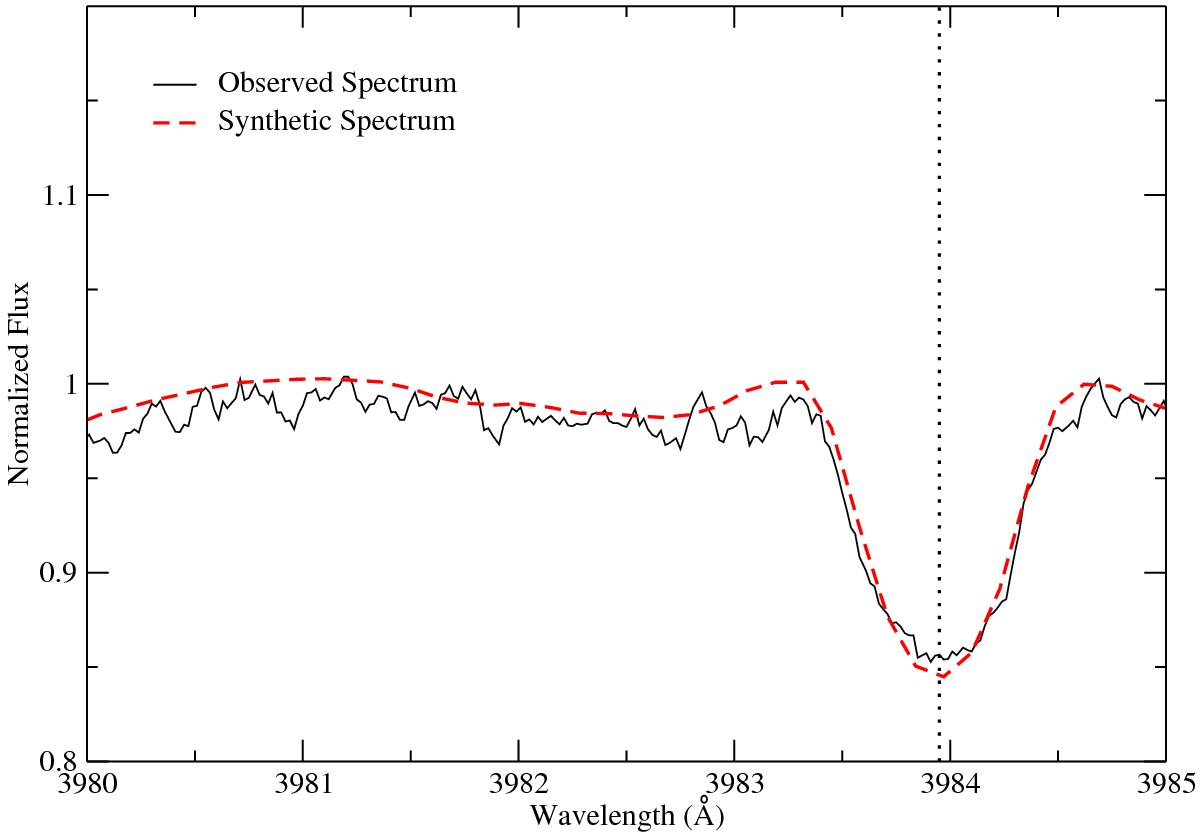
Comparison of the observed Hg ii 3983.93 Å line profile of HD 32867 to a synthetic profile computed for an overabundance of 130 000 solar. The vertical line depicts the location of the rest wavelength of the Hg ii line.
Current usage metrics show cumulative count of Article Views (full-text article views including HTML views, PDF and ePub downloads, according to the available data) and Abstracts Views on Vision4Press platform.
Data correspond to usage on the plateform after 2015. The current usage metrics is available 48-96 hours after online publication and is updated daily on week days.
Initial download of the metrics may take a while.