Fig. 7
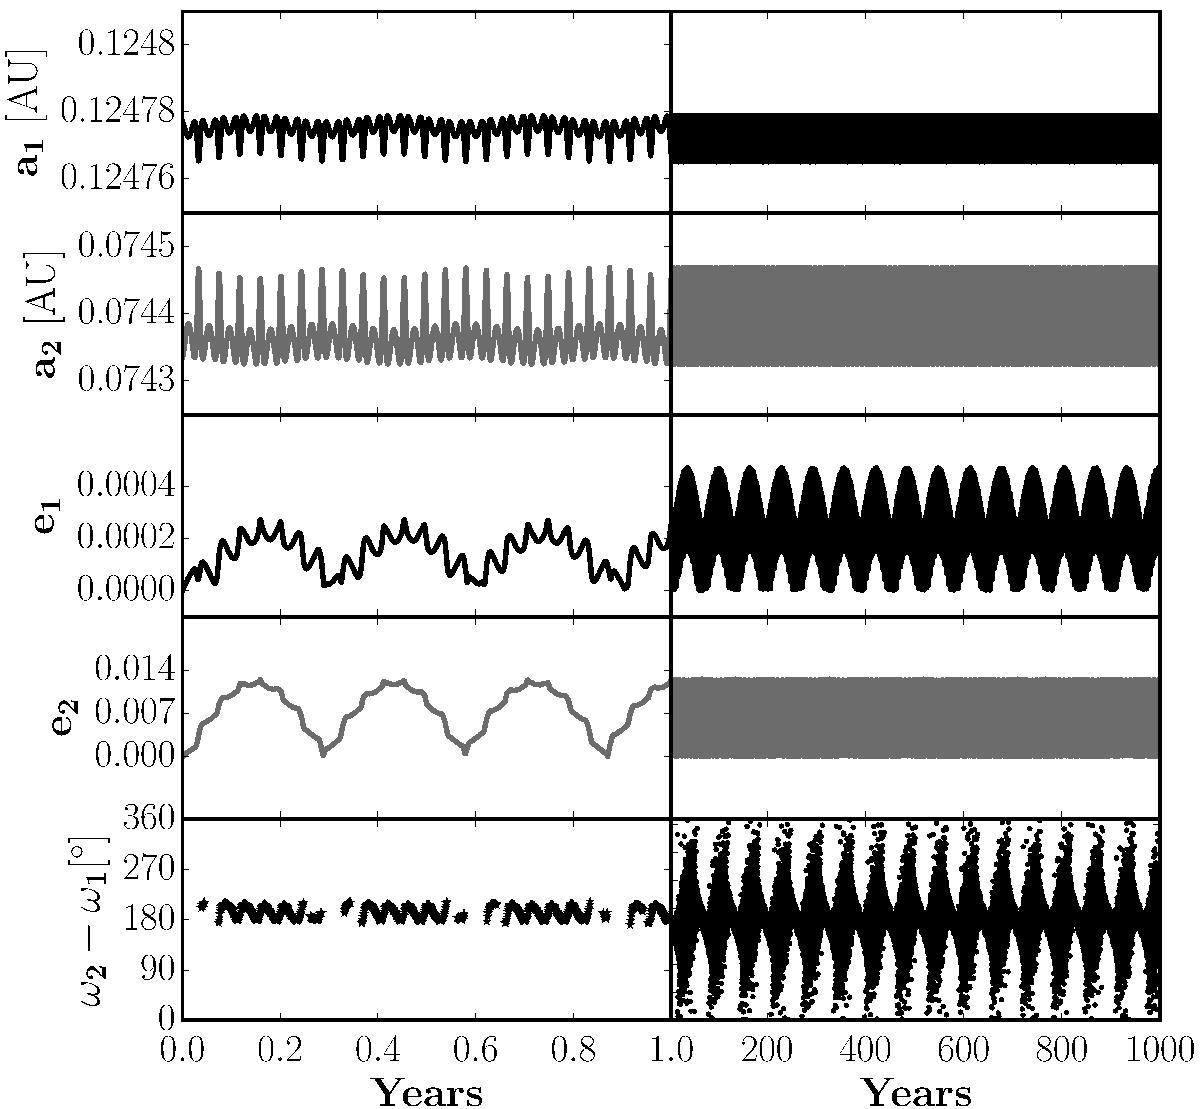
Orbital evolution of the best-fit system of two planets that started off on circular orbits but with unconstrained periods. Left: 1-year excerpt from the simulation. Right: excerpt for the following 999 yr. Both in the left and right part of the figure, the individual panels show from top to bottom the short-term variation of the semi-major axes a1 and a2, of the eccentricities e1 and e2, and of the difference of the longitudes of periastron ω2 − ω1. The last quantity is not plotted when one of the eccenticities are close to zero (e1 or e2< 0.0001) since then the longitude of periastron is undefined (hence the gaps in the lower left panel). The variation pattern of these parameters shows various periodicites of which the following can be most easily seen here: 15 d and 104 d (all five parameters, left part of figure), and 65 yr (e1 and ω2 − ω1; right part of figure).
Current usage metrics show cumulative count of Article Views (full-text article views including HTML views, PDF and ePub downloads, according to the available data) and Abstracts Views on Vision4Press platform.
Data correspond to usage on the plateform after 2015. The current usage metrics is available 48-96 hours after online publication and is updated daily on week days.
Initial download of the metrics may take a while.