Fig. 4
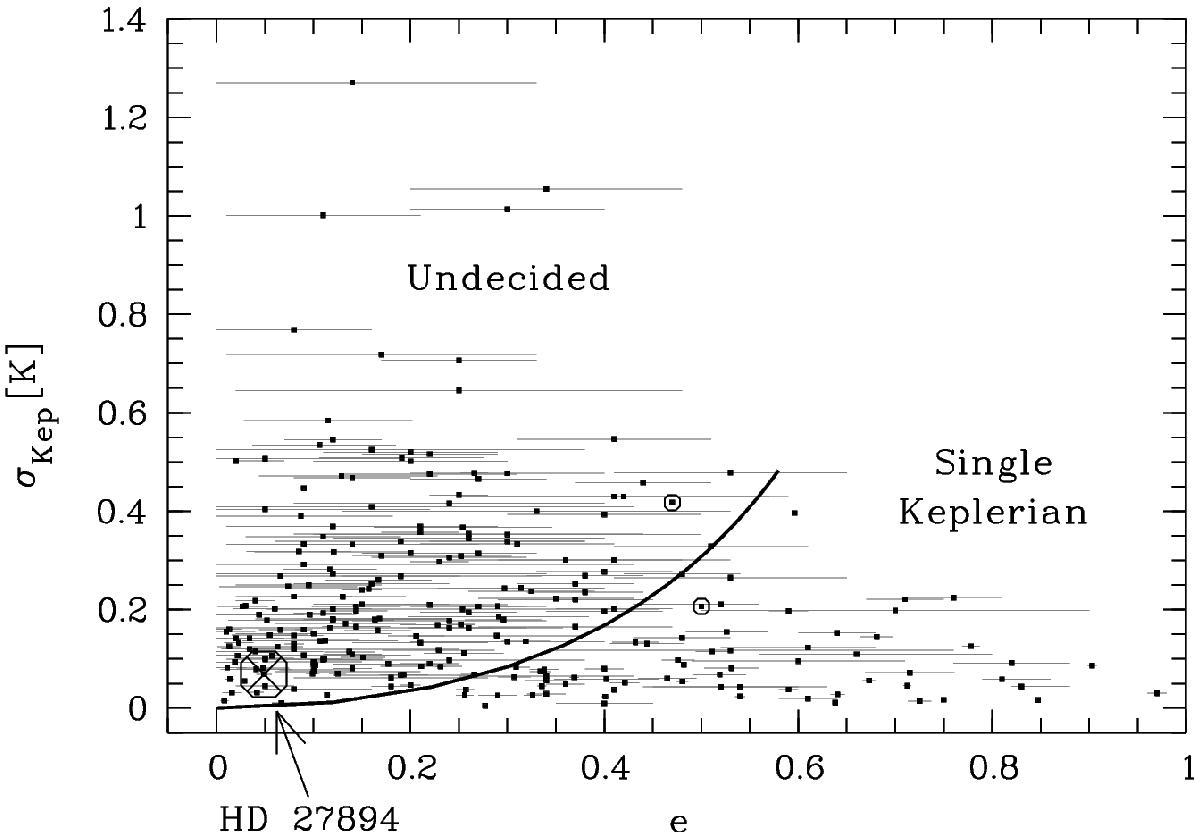
Rms scatter σKep of the RV solutions around single-planet Keplerian fits for our sample of 254 stars for which the EOD provides these values (dots). The scatter values are plotted as a function of the formal eccentricity of the Keplerian fit and in units of its RV semi-amplitude. 1σ-errors of the eccentricity are represented by grey horizontal bars. In two instances no errors are available; the pertinent data points are marked by small circles around them. The large circle and cross marks the case of HD 27894 that is studied in Sect. 4.3. The solid curve is identical to the solid line in Fig. 3 representing the deviation σmodel between the single-planet Keplerian model and the model for the 2:1 resonant pair of planets. Scatter values above the curve are larger than the expected deviation arising from applying the erroneous model (single Keplerian instead of 2:1 resonant pair) so that both models are possible, whereas scatter values below the curve are too small to assume an erroneous model and therefore favour the single Keplerian.
Current usage metrics show cumulative count of Article Views (full-text article views including HTML views, PDF and ePub downloads, according to the available data) and Abstracts Views on Vision4Press platform.
Data correspond to usage on the plateform after 2015. The current usage metrics is available 48-96 hours after online publication and is updated daily on week days.
Initial download of the metrics may take a while.