Fig. 3
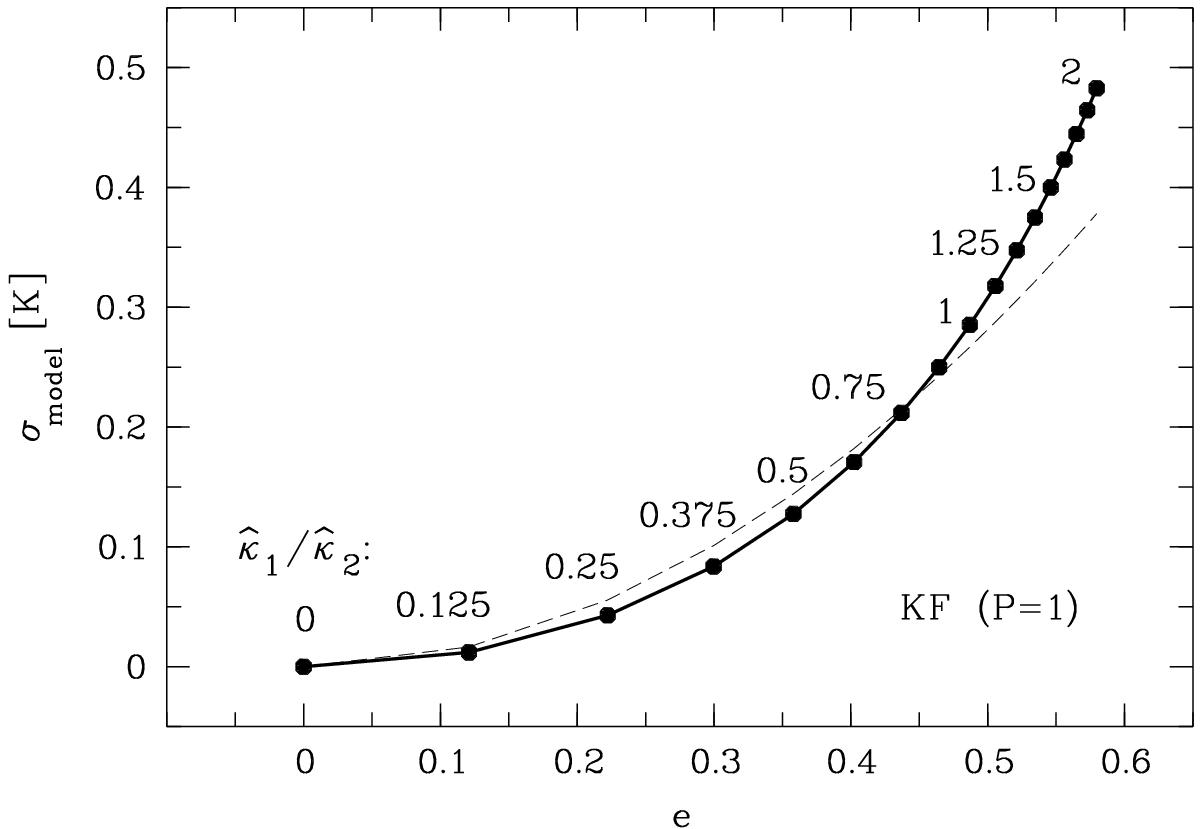
Rms deviation σmodel of the Keplerian fit with P = 1 from the 2:1 resonant input model (solid line with points and labels). This deviation is expressed in units of the RV semi-amplitude K and plotted as a function of the eccentricity e determined by the fit. The labels indicate the amplitude ratio ![]() of the input sinusoids. Thin dashed line: amplitude of the first harmonic in the Fourier expansion of the Kepler equation.
of the input sinusoids. Thin dashed line: amplitude of the first harmonic in the Fourier expansion of the Kepler equation.
Current usage metrics show cumulative count of Article Views (full-text article views including HTML views, PDF and ePub downloads, according to the available data) and Abstracts Views on Vision4Press platform.
Data correspond to usage on the plateform after 2015. The current usage metrics is available 48-96 hours after online publication and is updated daily on week days.
Initial download of the metrics may take a while.