Fig. 2
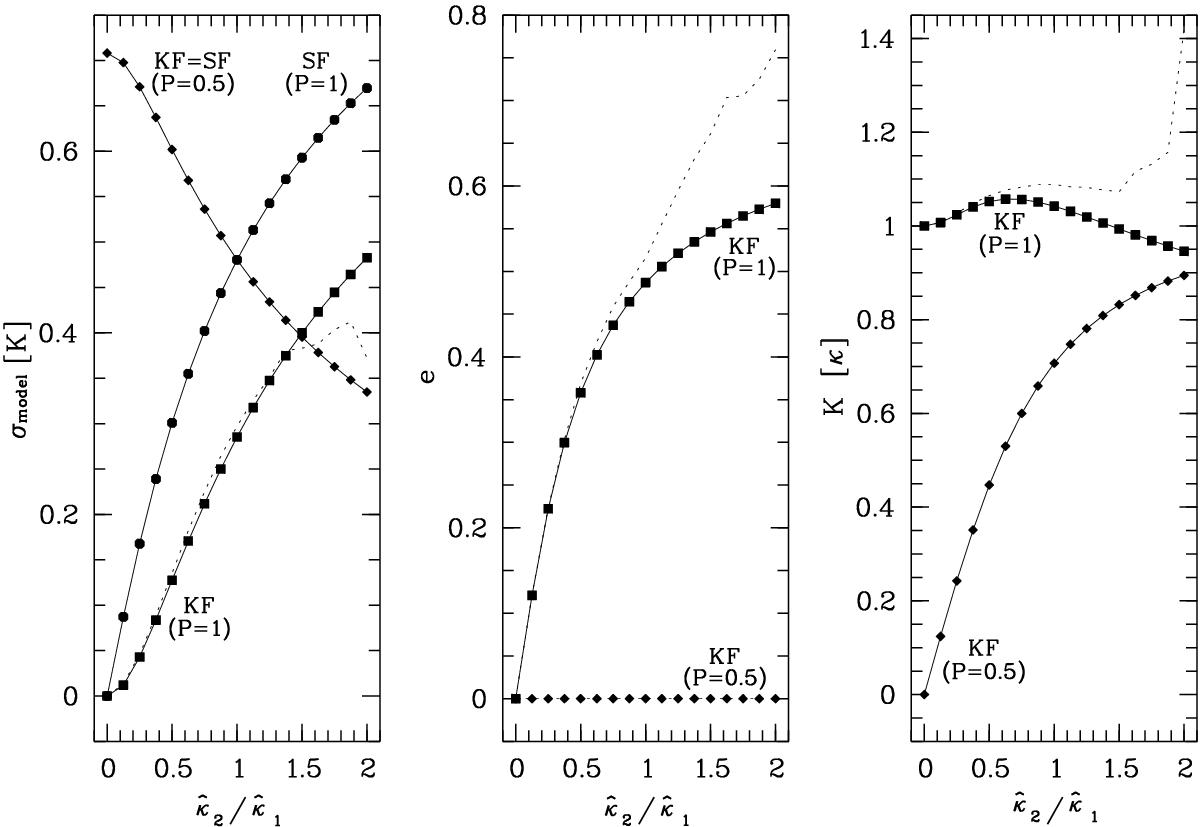
Results from our simulations of fitting 2:1-RCO data with various models. Left panel: the rms deviation σmodel between the various types of fit and the 2:1-RCO input data as a function of the amplitude ratio ![]() of the input data. Shown is σmodel for the single-component Keplerian fits (“KF”) and for the sine fits (“SF”) pertinent to the circular models. Note that σmodel is expressed in units of the semi-amplitude K of the Keplerian fit with Period P = 1. Middle panel: variation of the eccentricity e of the Keplerian fits with
of the input data. Shown is σmodel for the single-component Keplerian fits (“KF”) and for the sine fits (“SF”) pertinent to the circular models. Note that σmodel is expressed in units of the semi-amplitude K of the Keplerian fit with Period P = 1. Middle panel: variation of the eccentricity e of the Keplerian fits with ![]() . Right panel: the semi-amplitude K of the Keplerian fits as a function of
. Right panel: the semi-amplitude K of the Keplerian fits as a function of ![]() and normalized to one for
and normalized to one for ![]() . In all panels fits with period P = 1 are plotted with larger symbols than fits with P = 0.5 (see the labels at the curves). Thin dotted lines in all three panels: as a comparison we have included the result from a simulation for sparse data sampling based on the times at which the 20 RV measurements for the host star of HD 27894 were taken by Moutou et al. (2005). These thin dotted lines correspond to the median values for σmodel, e, and K, respectively, obtained from this simulation (Keplerian fits with P = 1 only). Note that for
. In all panels fits with period P = 1 are plotted with larger symbols than fits with P = 0.5 (see the labels at the curves). Thin dotted lines in all three panels: as a comparison we have included the result from a simulation for sparse data sampling based on the times at which the 20 RV measurements for the host star of HD 27894 were taken by Moutou et al. (2005). These thin dotted lines correspond to the median values for σmodel, e, and K, respectively, obtained from this simulation (Keplerian fits with P = 1 only). Note that for ![]() less than ≈ 0.5 they are located near the line for KF (P = 1) for e and K, whereas for σmodel the similarity holds up to
less than ≈ 0.5 they are located near the line for KF (P = 1) for e and K, whereas for σmodel the similarity holds up to ![]() .
.
Current usage metrics show cumulative count of Article Views (full-text article views including HTML views, PDF and ePub downloads, according to the available data) and Abstracts Views on Vision4Press platform.
Data correspond to usage on the plateform after 2015. The current usage metrics is available 48-96 hours after online publication and is updated daily on week days.
Initial download of the metrics may take a while.