Fig. 1
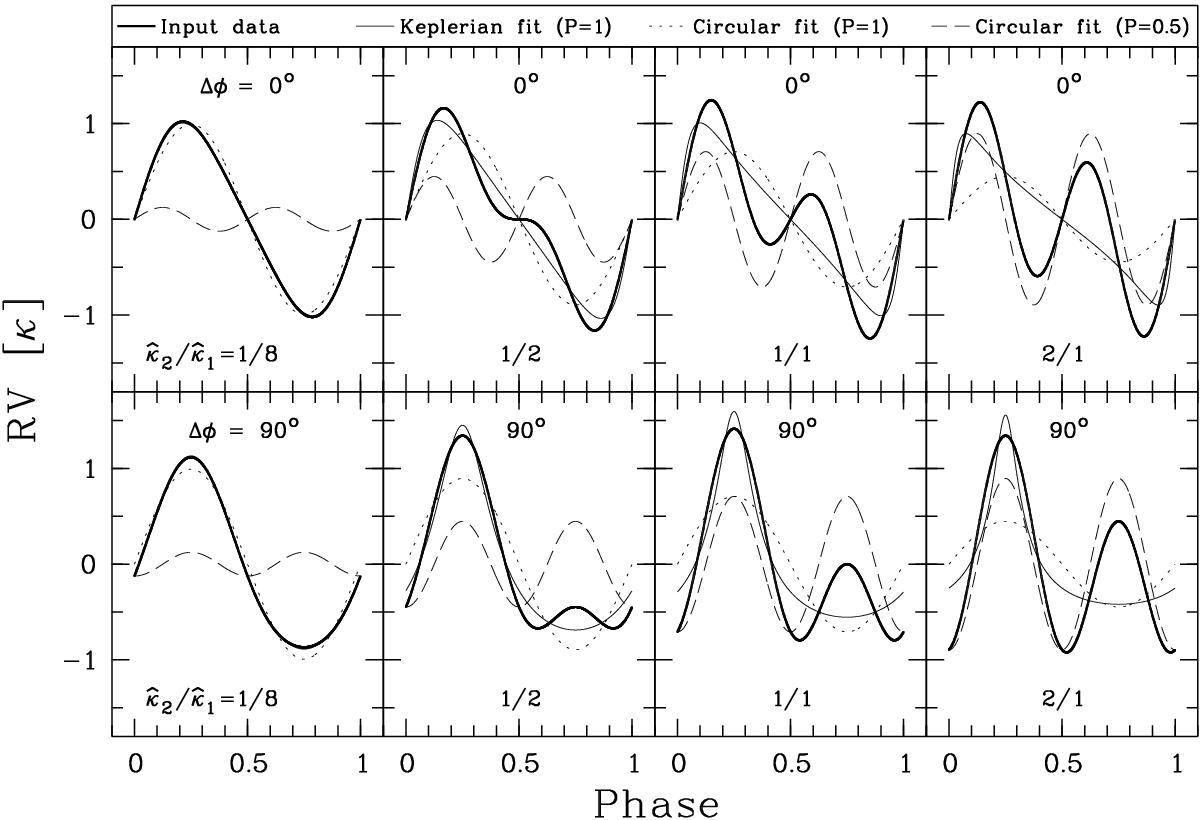
Examples for single-component fits to the RV data of a pair of 2:1-RCO planets. Thick solid lines represent the input data which are shown for amplitude ratios ![]() and 2/1 (from left to right) and values of the phase shift Δφ = 0° (upper row of panels) and 90° (lower row of panels). Thin solid lines depict the best-fitting Keplerian orbits with P = 1 (not discernible in the leftmost panels because of their very good match to the thick solid line). Dotted lines indicate best-fitting circular orbits (sine waves) with P = 1. Dashed lines stand for best-fitting circular orbits with P = 0.5. Note that the best-fitting Keplerian orbits with P = 0.5 are identical to the circular orbits with the same period, since the eccentricity vanishes for all fits. Plots for phase shifts of 180° and 270° can be obtained by flipping the 0° and the 90° plots, respectively, around the horizontal axis and then shifting them by 0.5 in phase.
and 2/1 (from left to right) and values of the phase shift Δφ = 0° (upper row of panels) and 90° (lower row of panels). Thin solid lines depict the best-fitting Keplerian orbits with P = 1 (not discernible in the leftmost panels because of their very good match to the thick solid line). Dotted lines indicate best-fitting circular orbits (sine waves) with P = 1. Dashed lines stand for best-fitting circular orbits with P = 0.5. Note that the best-fitting Keplerian orbits with P = 0.5 are identical to the circular orbits with the same period, since the eccentricity vanishes for all fits. Plots for phase shifts of 180° and 270° can be obtained by flipping the 0° and the 90° plots, respectively, around the horizontal axis and then shifting them by 0.5 in phase.
Current usage metrics show cumulative count of Article Views (full-text article views including HTML views, PDF and ePub downloads, according to the available data) and Abstracts Views on Vision4Press platform.
Data correspond to usage on the plateform after 2015. The current usage metrics is available 48-96 hours after online publication and is updated daily on week days.
Initial download of the metrics may take a while.