Fig. 4
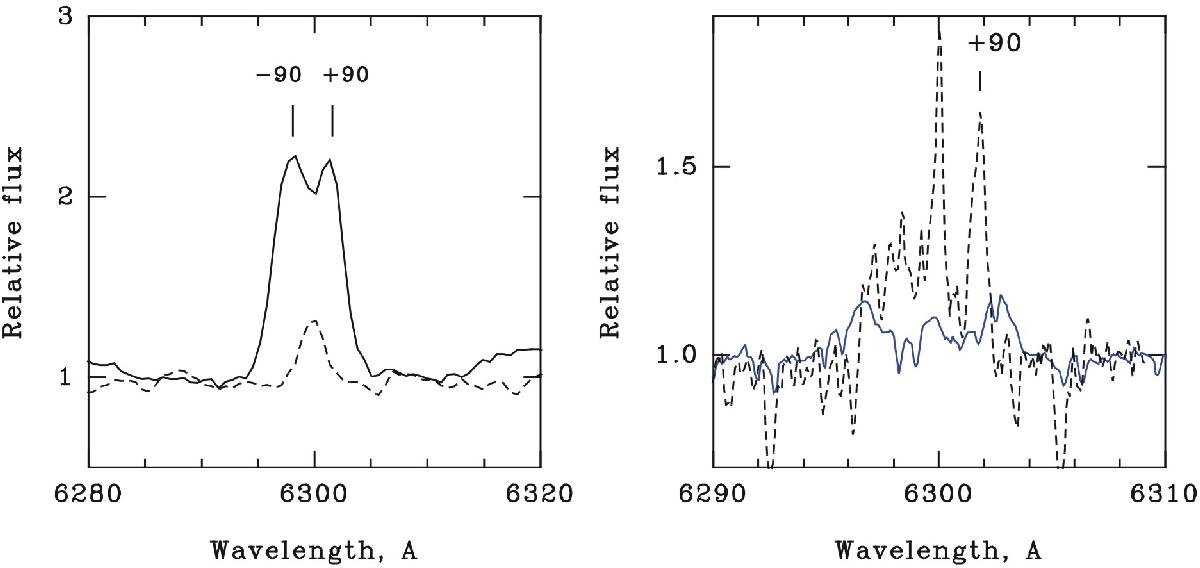
Left panel: ALFOSC spectra from 2014 covering the [O i] 6300 line. The strong lines at −90 and +90 km s-1 (solid) are from RW Aur A, while the single-emission component at zero velocity (dashed) is from RW Aur B. Right panel: high-resolution spectra of the same region. The dashed curve shows the [O i] profile from both RW Aur A and B in 2014, where the central peak belongs to RW Aur B, and the red-shifted sharp peak at +90 km s-1 belongs to RW Aur A. The blue-shifted emission is shallow. Numerous narrow telluric absorption components and photospheric lines from component B are present. The solid curve in the right panel shows the [O i] profile in 1996, with the central peak at zero velocity and two peaks at −140 and +140 km s-1. The forbidden lines are much stronger in the faint than in the bright state.
Current usage metrics show cumulative count of Article Views (full-text article views including HTML views, PDF and ePub downloads, according to the available data) and Abstracts Views on Vision4Press platform.
Data correspond to usage on the plateform after 2015. The current usage metrics is available 48-96 hours after online publication and is updated daily on week days.
Initial download of the metrics may take a while.