Fig. 1
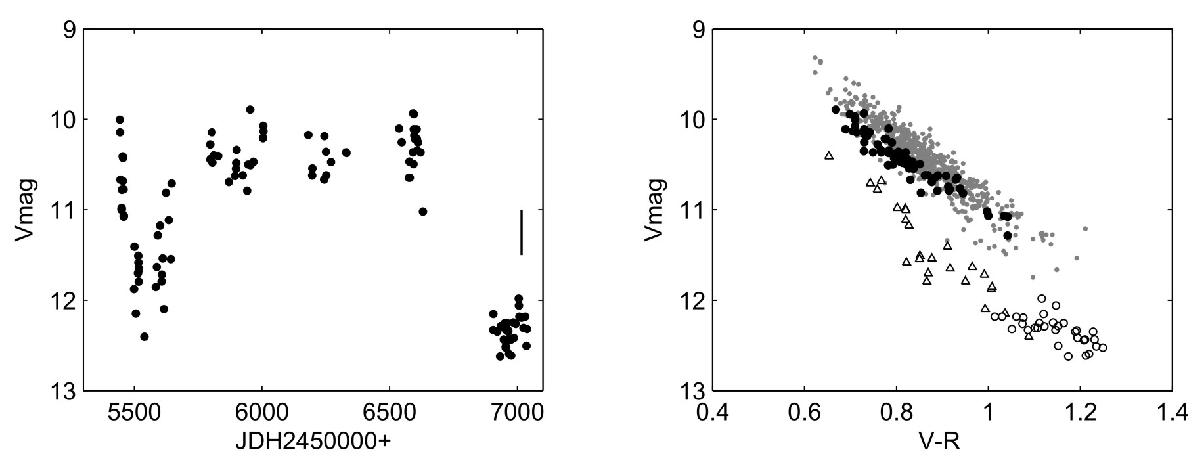
Left panel: light curve of RW Aur with the two minima during 2010 and 2014. The vertical bar indicates the time of our spectroscopic observations. Right panel: colour−magnitude diagram of RW Aur. Open circles: minimum during 2014. Triangles: minimum during 2010. Filled circles: bright state between the two minima. Grey dots: observations from 1986–2005. The colour index follows the Johnson system.
Current usage metrics show cumulative count of Article Views (full-text article views including HTML views, PDF and ePub downloads, according to the available data) and Abstracts Views on Vision4Press platform.
Data correspond to usage on the plateform after 2015. The current usage metrics is available 48-96 hours after online publication and is updated daily on week days.
Initial download of the metrics may take a while.