Fig. A.1
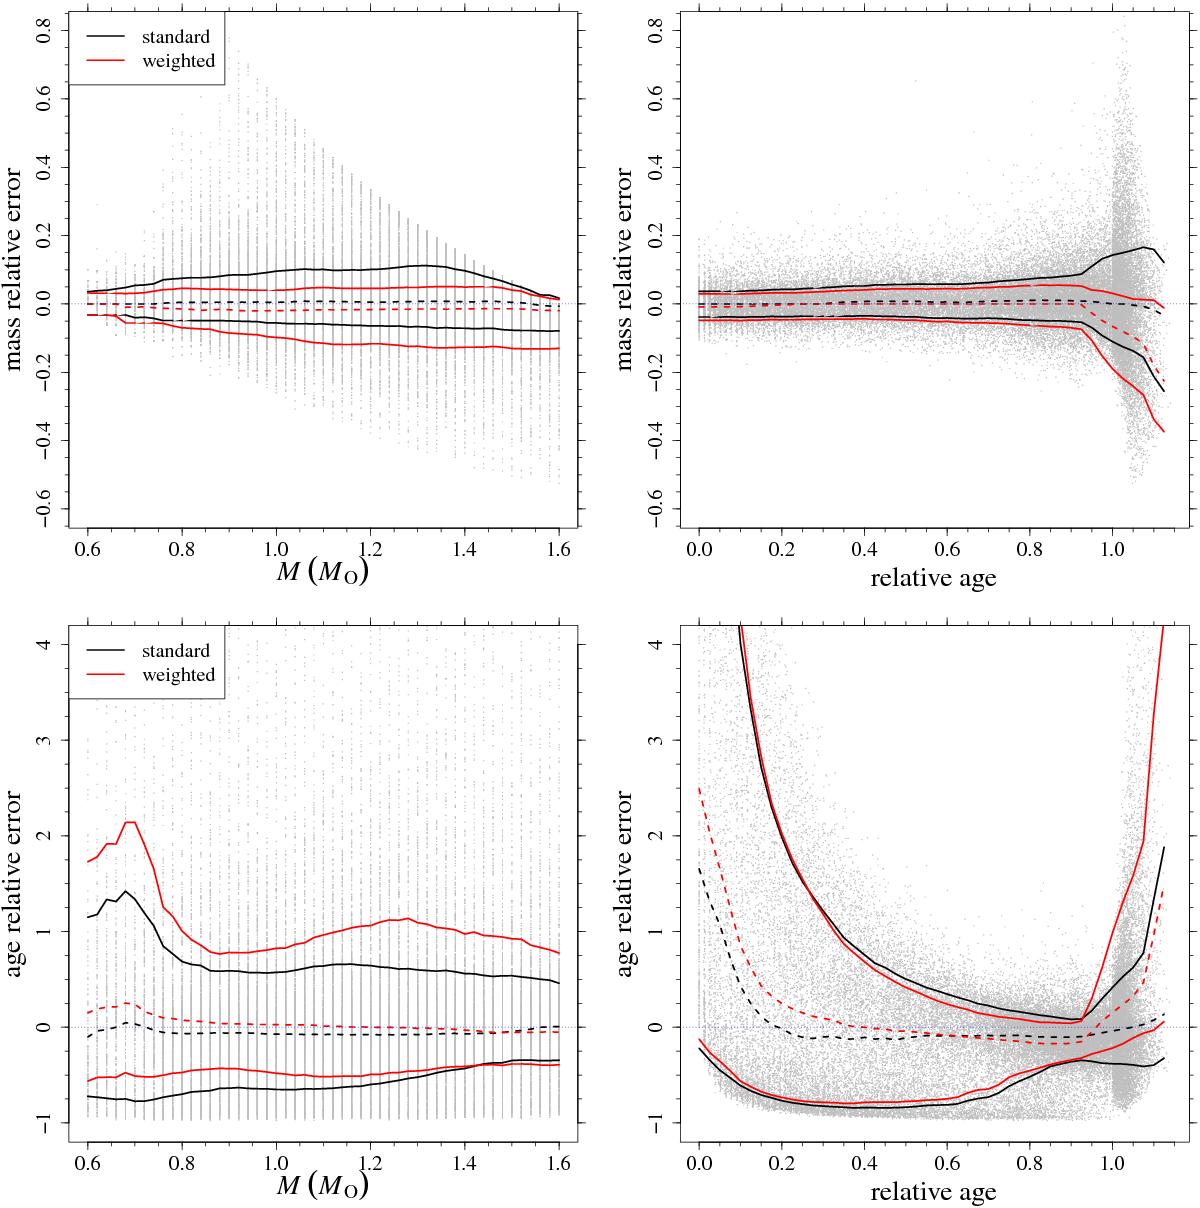
Top row: left Monte Carlo relative errors on mass estimate as a function of the true mass of the stars. The black lines show the position of the median (dashed line) and the 1σ envelope (solid line). The red lines show the corresponding quantities, but for weighted estimates. Right: same as in the left panel, but as a function of the relative age of the stars. Bottom row: same as the top row, but for age estimates.
Current usage metrics show cumulative count of Article Views (full-text article views including HTML views, PDF and ePub downloads, according to the available data) and Abstracts Views on Vision4Press platform.
Data correspond to usage on the plateform after 2015. The current usage metrics is available 48-96 hours after online publication and is updated daily on week days.
Initial download of the metrics may take a while.