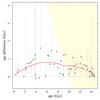
Fig. 6
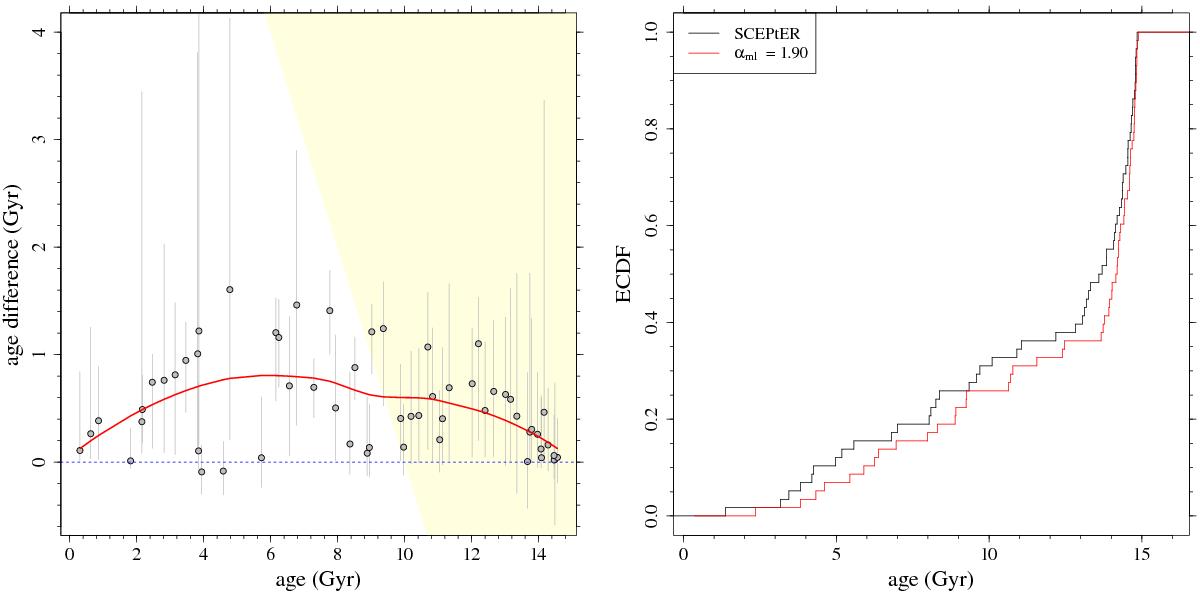
Left: same as in the left panel of Fig. 5, but for age differences due to assuming the grid with αml = 1.90 and the reference case with αml = 1.74. Right: empirical cumulative distribution functions for the upper limits of the estimated ages obtained by SCEPtER adopting the standard grid with αml = 1.74 (black line), and that with αml = 1.90 (red line).
Current usage metrics show cumulative count of Article Views (full-text article views including HTML views, PDF and ePub downloads, according to the available data) and Abstracts Views on Vision4Press platform.
Data correspond to usage on the plateform after 2015. The current usage metrics is available 48-96 hours after online publication and is updated daily on week days.
Initial download of the metrics may take a while.