Fig. 4
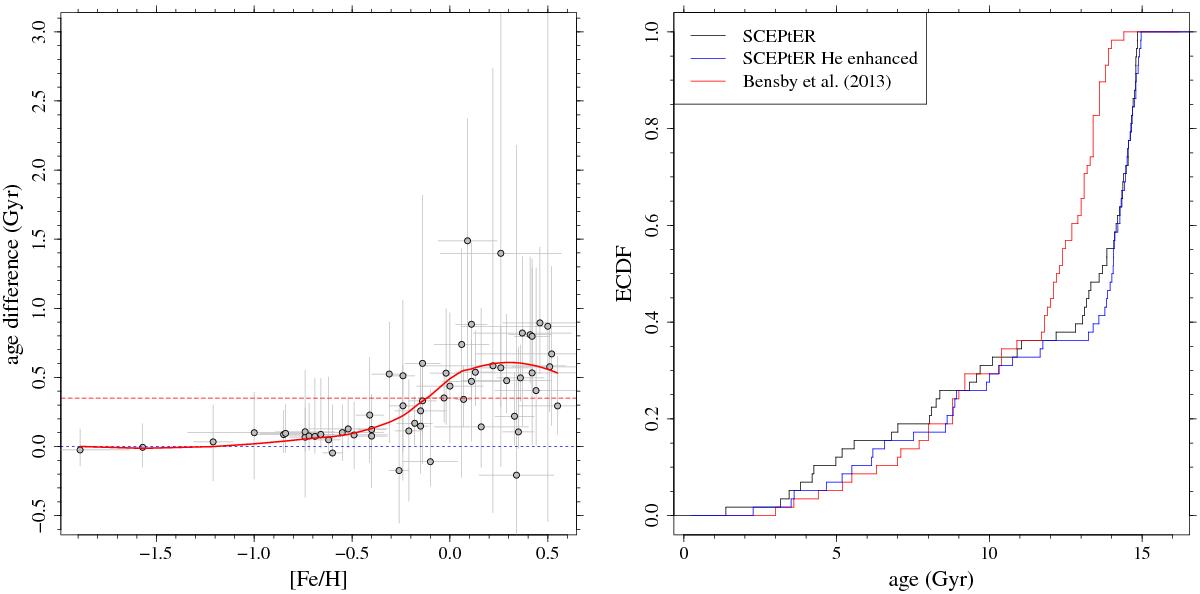
Left: differences between the age estimates obtained by adopting the grid with ΔY/ ΔZ = 5 (helium-enhanced) and that with ΔY/ ΔZ = 2 (standard). The red dashed line marks the mean of the differences, while the solid red line is a LOESS smoother of the data (see text). Right: empirical cumulative distribution functions for the upper limits of the estimated ages obtained by SCEPtER assuming the standard initial helium value (black line), the helium-enhanced scenario (blue line), and for the ages estimated by Bensby et al. (2013) (red line).
Current usage metrics show cumulative count of Article Views (full-text article views including HTML views, PDF and ePub downloads, according to the available data) and Abstracts Views on Vision4Press platform.
Data correspond to usage on the plateform after 2015. The current usage metrics is available 48-96 hours after online publication and is updated daily on week days.
Initial download of the metrics may take a while.