Fig. 9
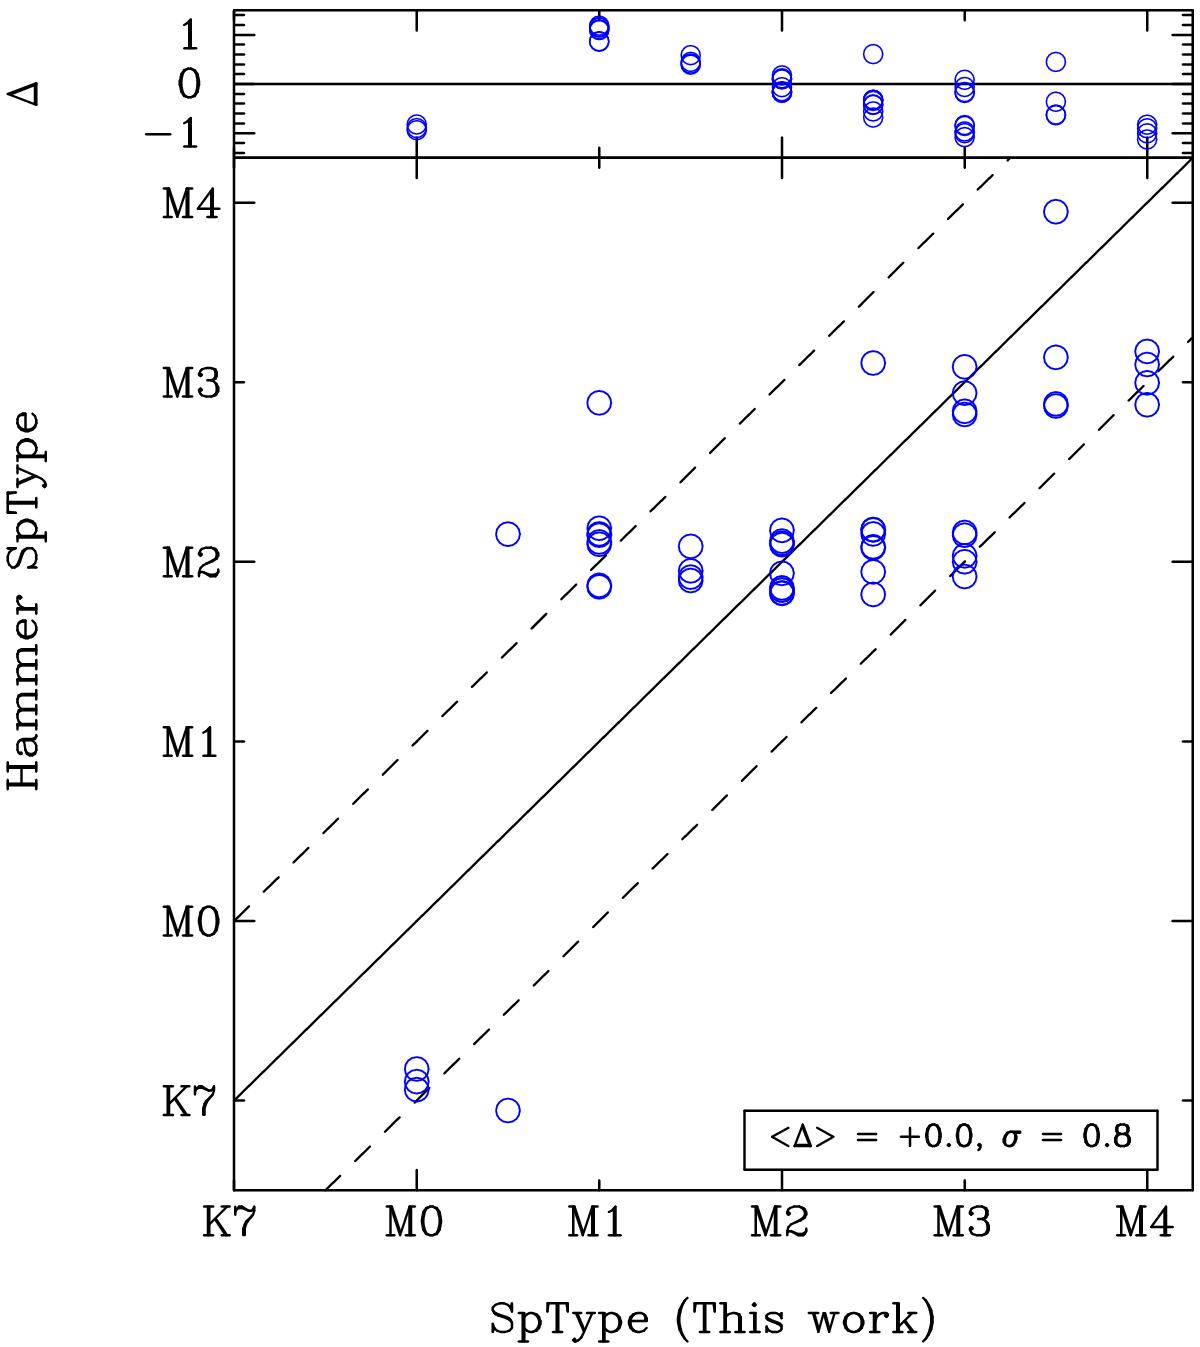
M subtype values obtained by using the code HAMMER versus the values obtained in this work. Upper panel: differences with the values given in the literature. Random values between ±0.2 have been added to the HAMMER values to facilitate the comparison. The symbol ⟨⟩ in the legend represents the median difference. The black continuous line represents the 1:1 relation, whilst the dashed lines correspond to ±1 spectral subtype.
Current usage metrics show cumulative count of Article Views (full-text article views including HTML views, PDF and ePub downloads, according to the available data) and Abstracts Views on Vision4Press platform.
Data correspond to usage on the plateform after 2015. The current usage metrics is available 48-96 hours after online publication and is updated daily on week days.
Initial download of the metrics may take a while.