Free Access
Fig. 7
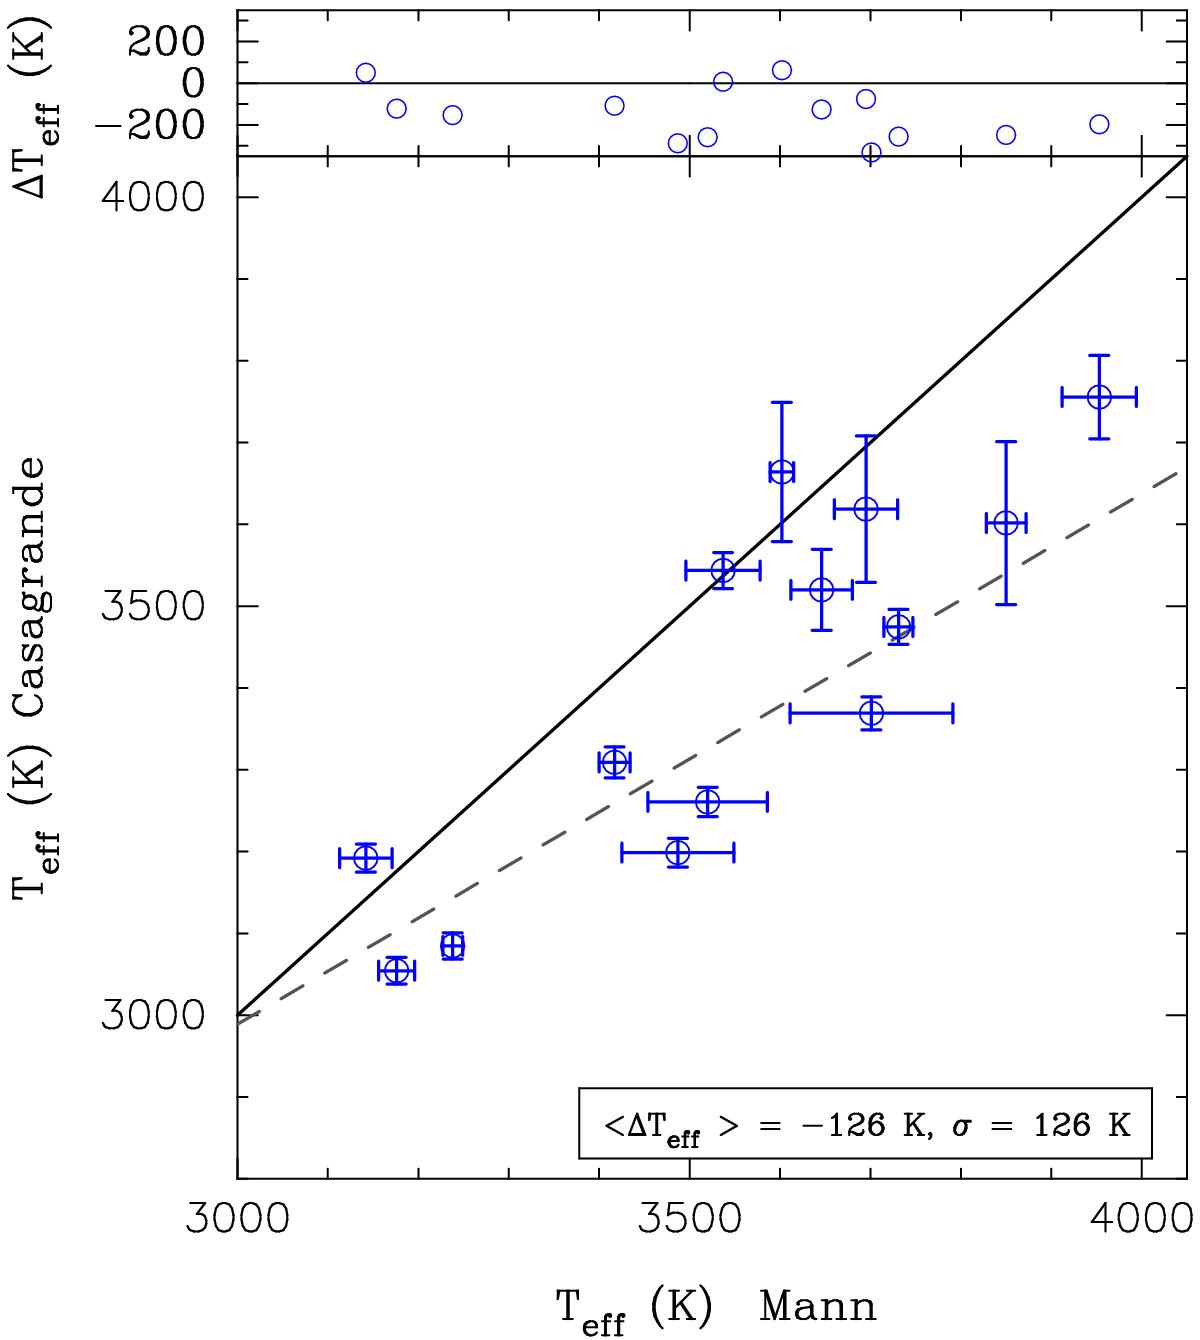
Teff estimates based on the calibration provided by CA08 versus values from Mann et al. (2013b) and Newton et al. (2015). Upper panel: differences. The symbol ⟨⟩ in the legend represents the median difference. The black continuous line represents the 1:1 relation, whilst the grey dashed line represents the best linear fit.
Current usage metrics show cumulative count of Article Views (full-text article views including HTML views, PDF and ePub downloads, according to the available data) and Abstracts Views on Vision4Press platform.
Data correspond to usage on the plateform after 2015. The current usage metrics is available 48-96 hours after online publication and is updated daily on week days.
Initial download of the metrics may take a while.