Fig. 6
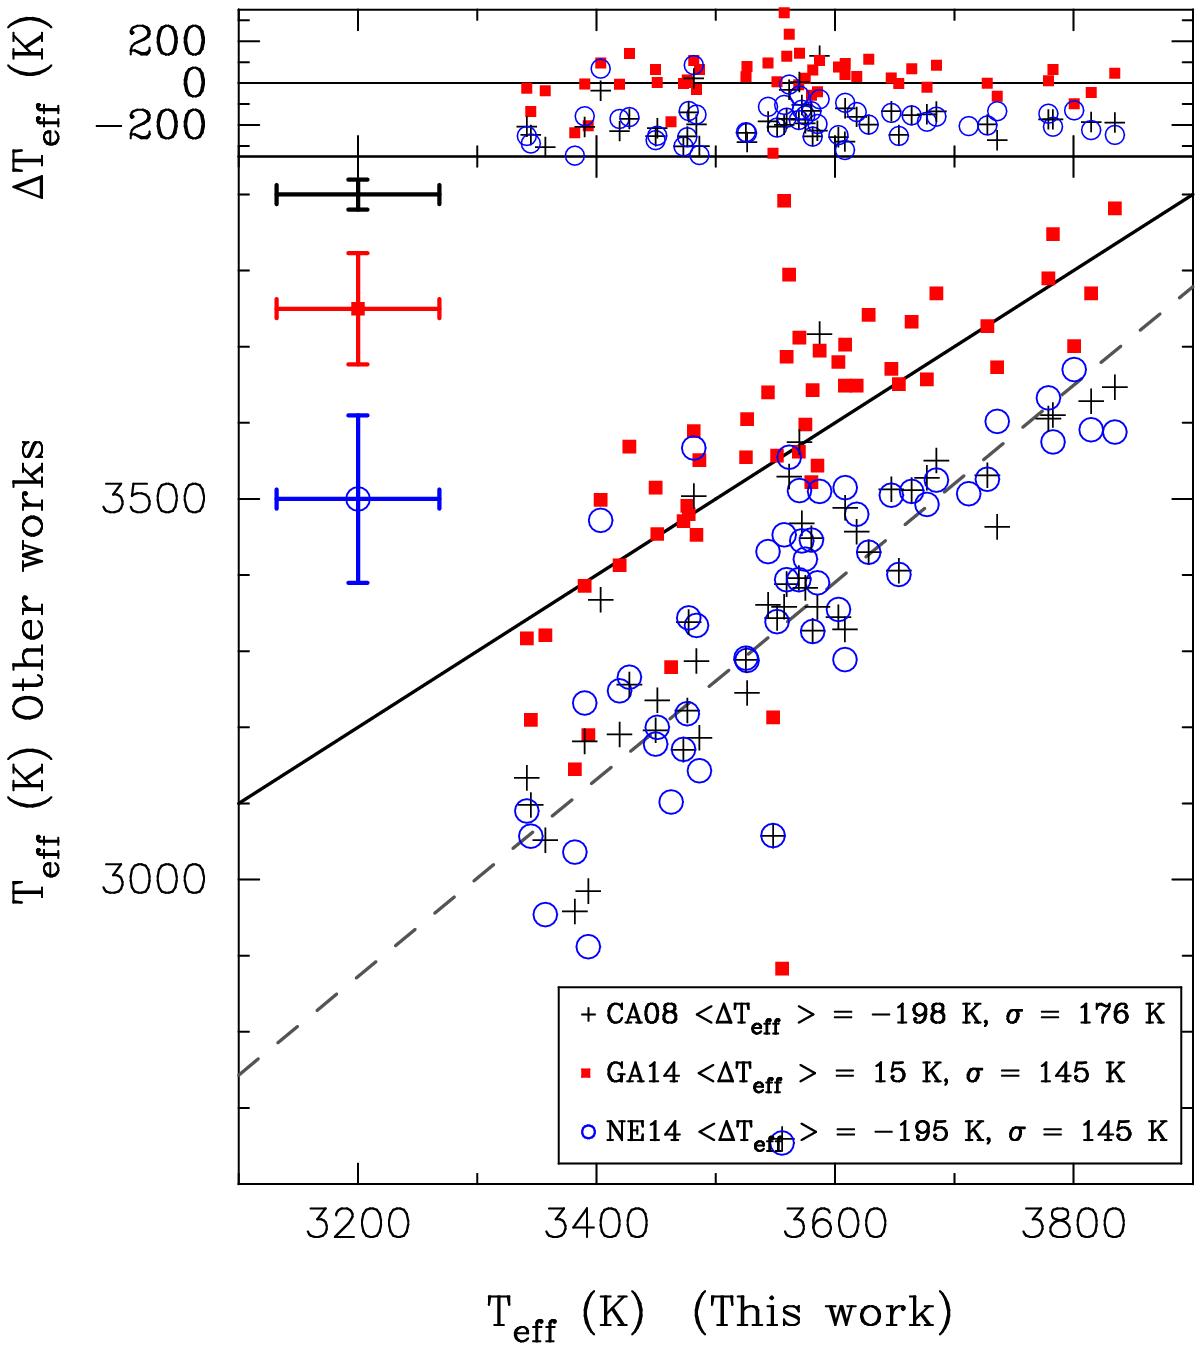
Teff values from the literature estimates versus the values obtained in this work. Upper panel: differences between the temperatures given in the literature and the values derived in this work. Median uncertainties in the derived temperatures are also shown. The symbol ⟨⟩ in the legend represents the median difference. The black continuous line represents the 1:1 relation, whilst the grey dashed line represents the best linear fit between our estimates and those obtained using the relationship of CA08 (see text in Sect. 4.1).
Current usage metrics show cumulative count of Article Views (full-text article views including HTML views, PDF and ePub downloads, according to the available data) and Abstracts Views on Vision4Press platform.
Data correspond to usage on the plateform after 2015. The current usage metrics is available 48-96 hours after online publication and is updated daily on week days.
Initial download of the metrics may take a while.