Fig. 3
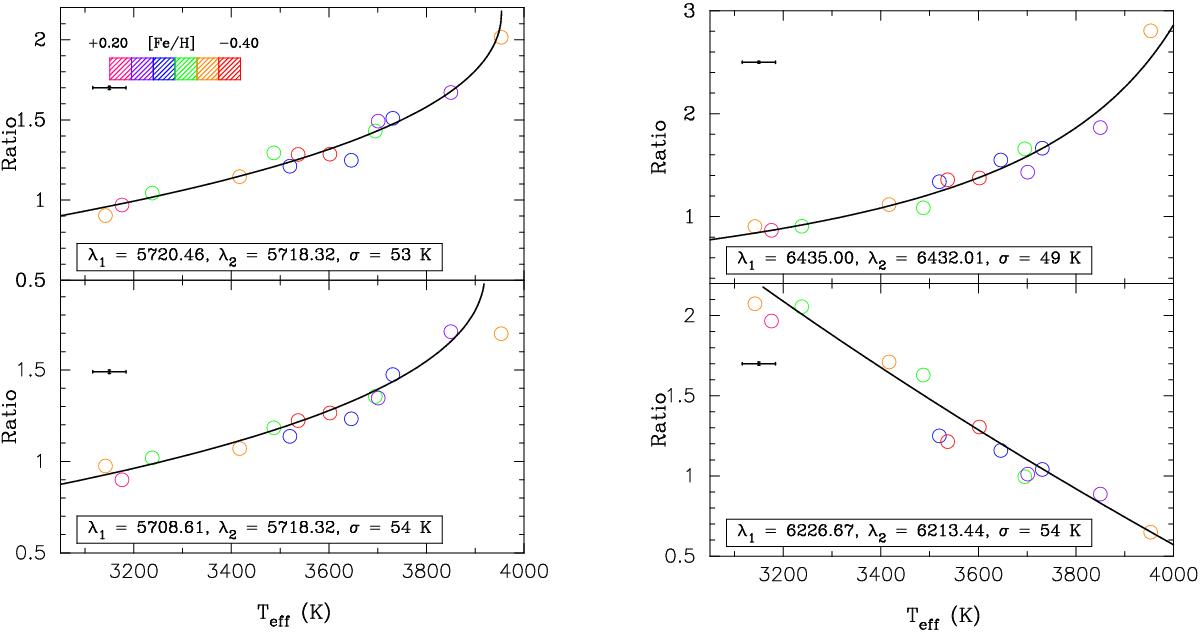
Examples of ratios of some features identified to be sensitive to Teff in early-M dwarfs. Stars are plotted using different colours according to their metallicity (using bins of 0.10 dex length). Median uncertainties are shown in the left upper corner of each plot. The corresponding fits are also plotted. The features’ central wavelengths as well as the rms standard deviation of the residuals are given in each plot.
Current usage metrics show cumulative count of Article Views (full-text article views including HTML views, PDF and ePub downloads, according to the available data) and Abstracts Views on Vision4Press platform.
Data correspond to usage on the plateform after 2015. The current usage metrics is available 48-96 hours after online publication and is updated daily on week days.
Initial download of the metrics may take a while.