Fig. 12
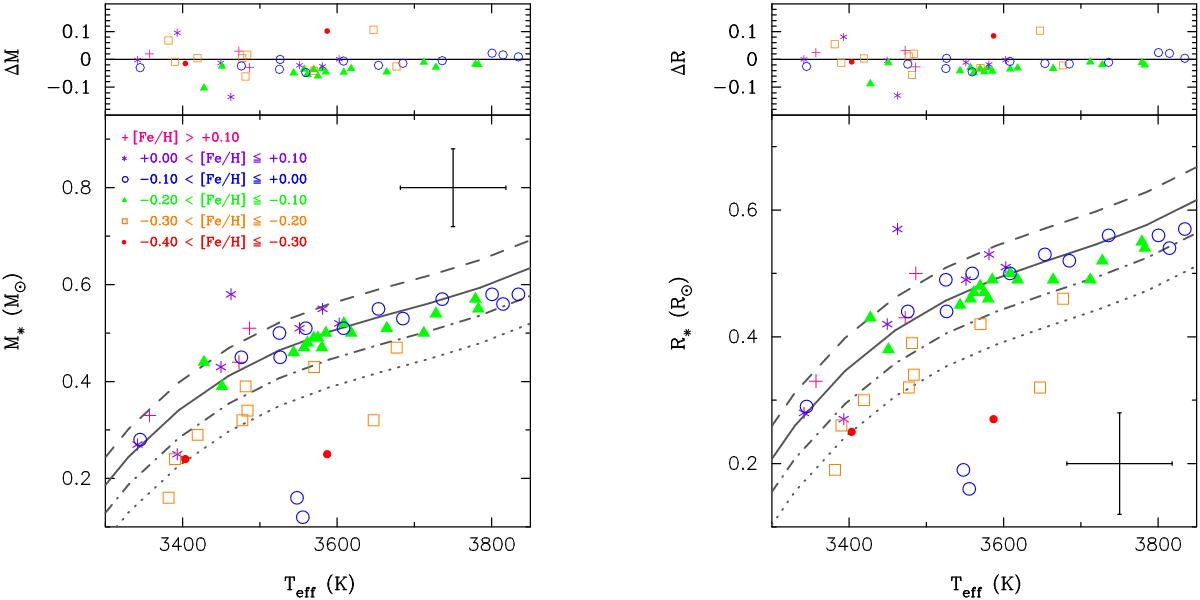
Stellar mass (left panel), and radius (right panel) as a function of the effective temperature. Stars are plotted using different colours and symbols according to their metallicity. Several fits for fixed metallicity values are plotted: +0.15 (dashed line), +0.00 (solid line), −0.15 (dashed-dotted line), and −0.30 (dotted line). Upper left panel: differences between the mass obtained from Eq. (5) and those derived by using the relationship reported by Henry & McCarthy (1993). Upper right panel: differences between the radius derived from Eq. (6) and by using Eq. (4).
Current usage metrics show cumulative count of Article Views (full-text article views including HTML views, PDF and ePub downloads, according to the available data) and Abstracts Views on Vision4Press platform.
Data correspond to usage on the plateform after 2015. The current usage metrics is available 48-96 hours after online publication and is updated daily on week days.
Initial download of the metrics may take a while.