Fig. 10
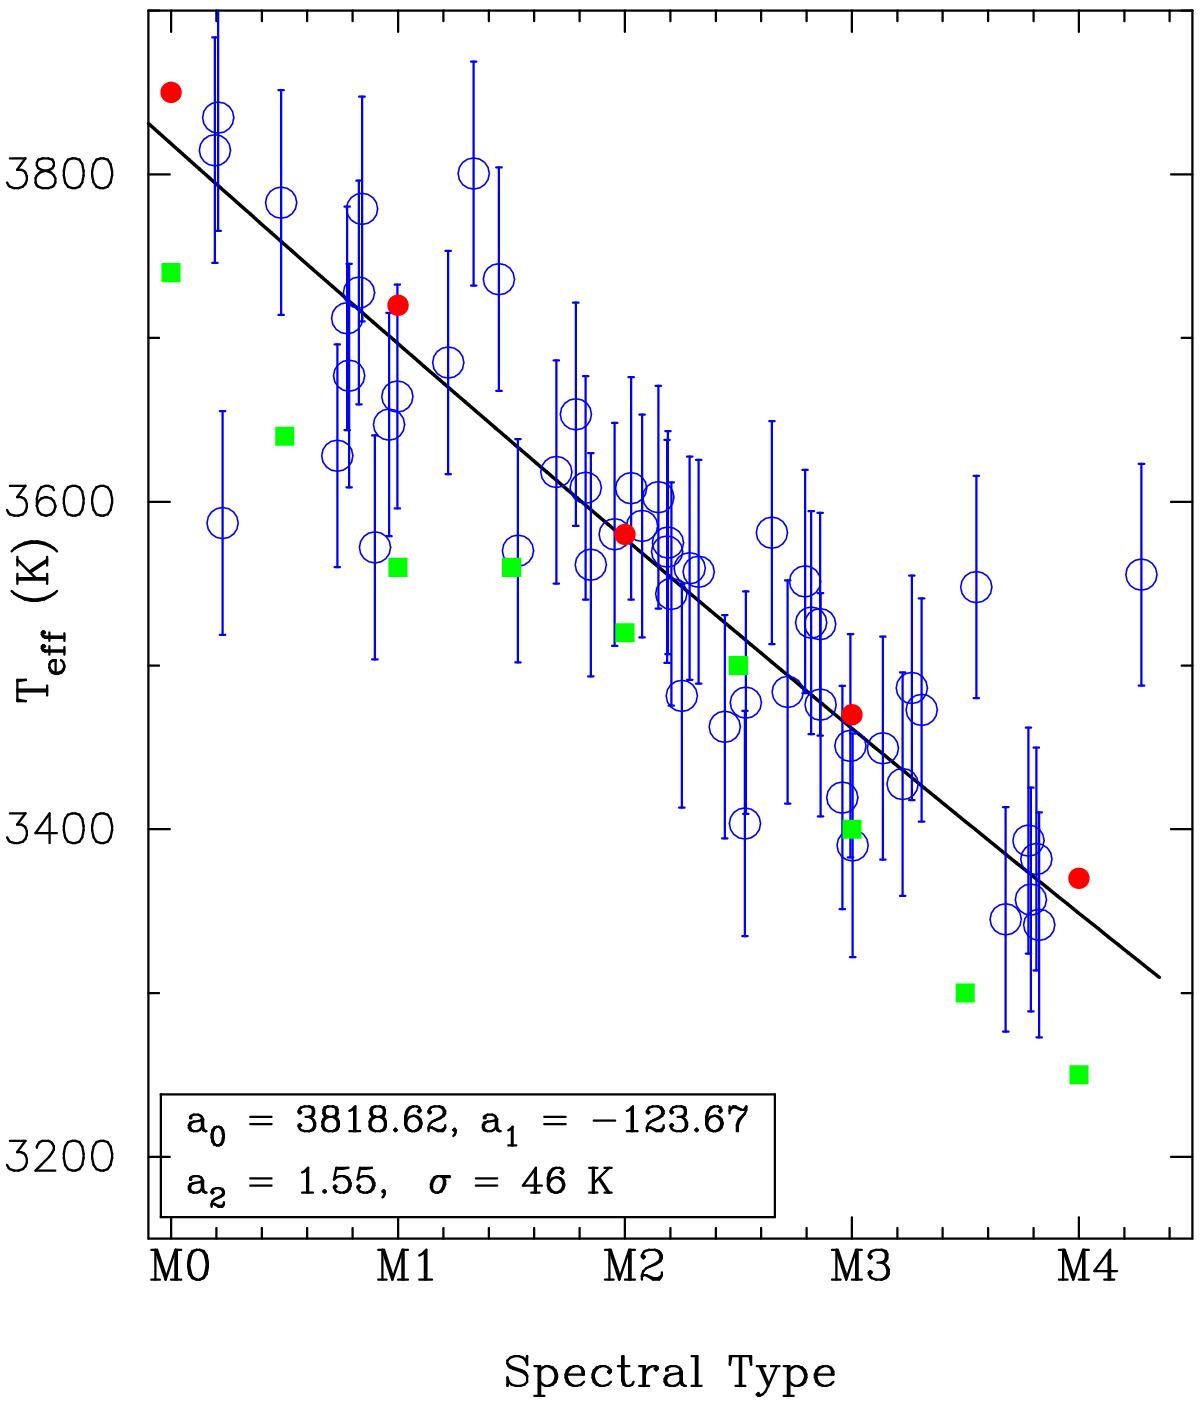
Effective temperature as a function of the spectral type. For clarity the spectral types are not rounded. A second-order polynomial fit is shown. Possible outliers are removed by using a 2.5σ clipping procedure. The coefficients of the fit as well as the rms standard deviation are given in the plot. Data from Kenyon & Hartmann (1995, Table A.5) are overplotted using red filled circles, whilst green squares represent the median Teff-spectral type sequence from Lépine et al. (2013).
Current usage metrics show cumulative count of Article Views (full-text article views including HTML views, PDF and ePub downloads, according to the available data) and Abstracts Views on Vision4Press platform.
Data correspond to usage on the plateform after 2015. The current usage metrics is available 48-96 hours after online publication and is updated daily on week days.
Initial download of the metrics may take a while.