Fig. 6
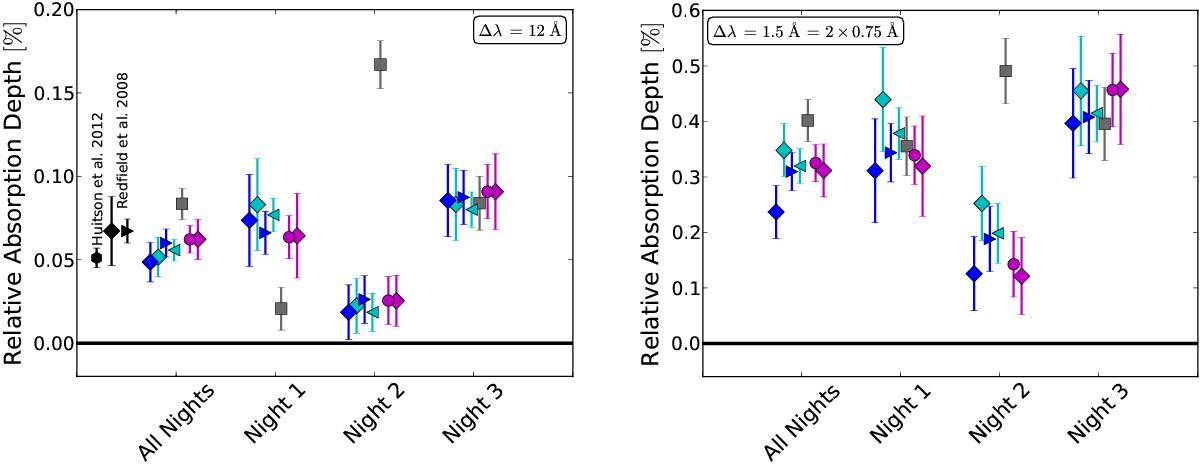
Comparison of the different methods. The relative absorption depth of the sodium lines are shown for all the nights and for the different methods. Gray squares are the measurement levels without any correction. Particularly, telluric lines imprint spurious systematics in any directions. Magenta circles and diamonds are measurements made with the light-curve method and the empirical Monte Carlo analysis. The blue left triangle and diamond are for the transmission spectrum without radial-velocity correction and the corresponding empirical Monte Carlo analyses. The cyan right triangles and diamonds are for the transmission spectrum with planetary radial-velocity correction and the corresponding empirical Monte Carlo analysis. The total absorption depth when adding the entire night are also indicated. Left: summary for the 12 Å passband. The measurement of Huitson et al. (2012; 3 transits with HST/STIS) is shown as a black hexagon. The measurement of Redfield et al. (2008; 35 exposures in-transit (600 s) observed during 11 transit events) is shown as the black left triangle and diamond. The errors correspond to their photon noise and empirical Monte Carlo analysis. The HARPS precision is comparable with the HST/STIS precision, which shows the importance of ground-based high-resolution observations of exoplanetary atmospheres. Right: summary of the 1.5 = 2 × 0.75 Å passband.
Current usage metrics show cumulative count of Article Views (full-text article views including HTML views, PDF and ePub downloads, according to the available data) and Abstracts Views on Vision4Press platform.
Data correspond to usage on the plateform after 2015. The current usage metrics is available 48-96 hours after online publication and is updated daily on week days.
Initial download of the metrics may take a while.