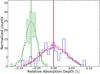
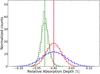
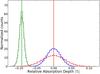
Fig. 4
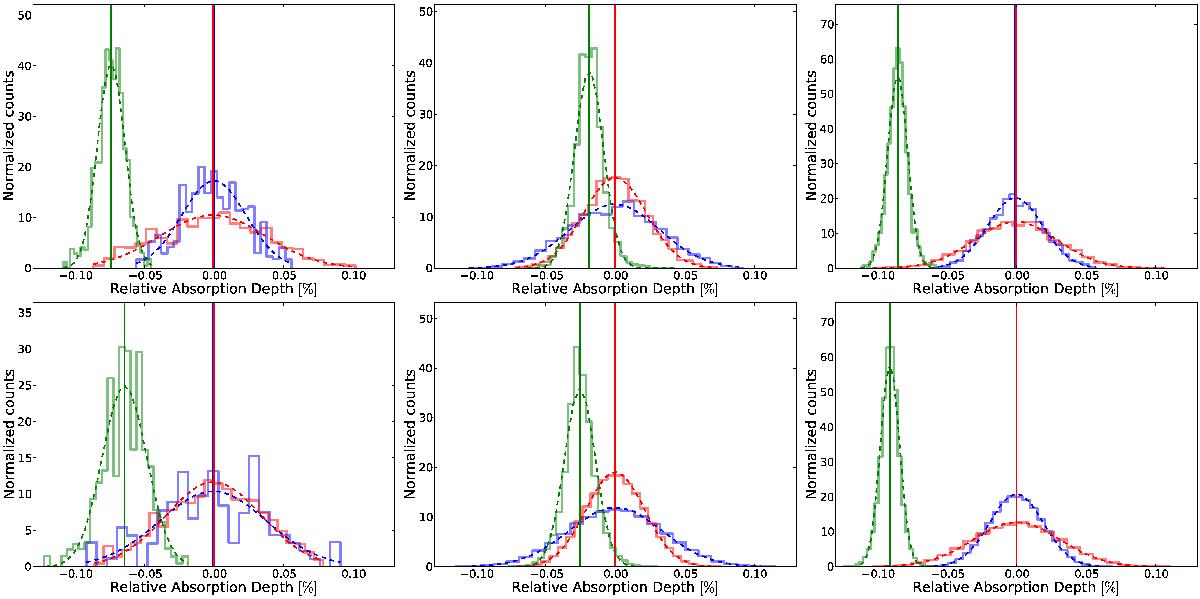
Distributions of the empirical Monte Carlo analysis for the 12 Å passband. Top row: results for the transmission spectrum method. Bottom row: results for the light-curve method. The columns correspond to the three different observation nights (nights 1 to 3, from left to right). In-in, out-out and in-out scenarios are shown in blue, red, and green. Distributions are shown as continuous lines, the Gaussian fit to the distribution as dotted lines, and vertical lines are the average values. Results on the measurements and errors caused by these distributions are summarized in Fig. 6, where we compare it to the nominal values.
Current usage metrics show cumulative count of Article Views (full-text article views including HTML views, PDF and ePub downloads, according to the available data) and Abstracts Views on Vision4Press platform.
Data correspond to usage on the plateform after 2015. The current usage metrics is available 48-96 hours after online publication and is updated daily on week days.
Initial download of the metrics may take a while.