Fig. 2
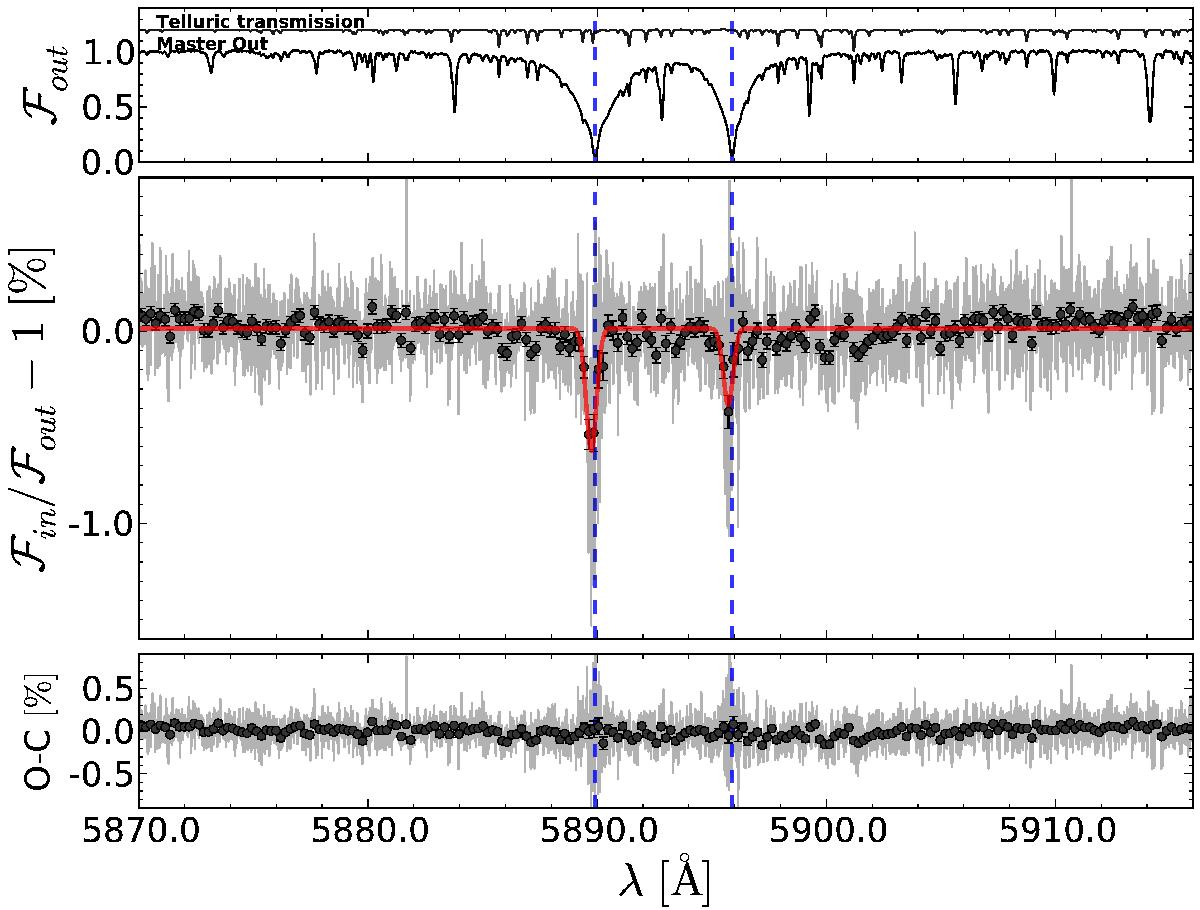
HARPS transmission spectrum of HD 189733b around the sodium Na i D doublet. Upper panel: master-out spectrum (stack of the out-of-transit spectra) normalized to unity. A telluric spectrum is also shown with a vertical offset to be able to identify water telluric lines. Middle panel: overall transmission spectrum of the exoplanet atmosphere taking into account all the observing nights (light gray). The transmission spectrum is shown binned by 20× with black circles. The planetary radial-velocity correction is applied. We can easily see the core absorption of the two Na i D lines from the planetary atmosphere. We show a Gaussian fit to each Na i D lines (red). We measure line contrasts of 0.64 ± 0.07% (D2) and 0.40 ± 0.07% (D1) and FWHMs of 0.52 ± 0.08 Å. The transition wavelengths of the doublet in the planet rest frame are indicated with the blue dashed line. A net blueshift is measured from our fit with a value of 0.16 ± 0.04 Å. This blueshift may be due to wind in the upper layer of the atmosphere with a velocity of 8 ± 2 km s-1 (see text). Lower panel: residuals to the Gaussian fit. The noisy part is centered on the wavelength of the two sodium lines where the stellar flux is the lowest.
Current usage metrics show cumulative count of Article Views (full-text article views including HTML views, PDF and ePub downloads, according to the available data) and Abstracts Views on Vision4Press platform.
Data correspond to usage on the plateform after 2015. The current usage metrics is available 48-96 hours after online publication and is updated daily on week days.
Initial download of the metrics may take a while.