Fig. 3
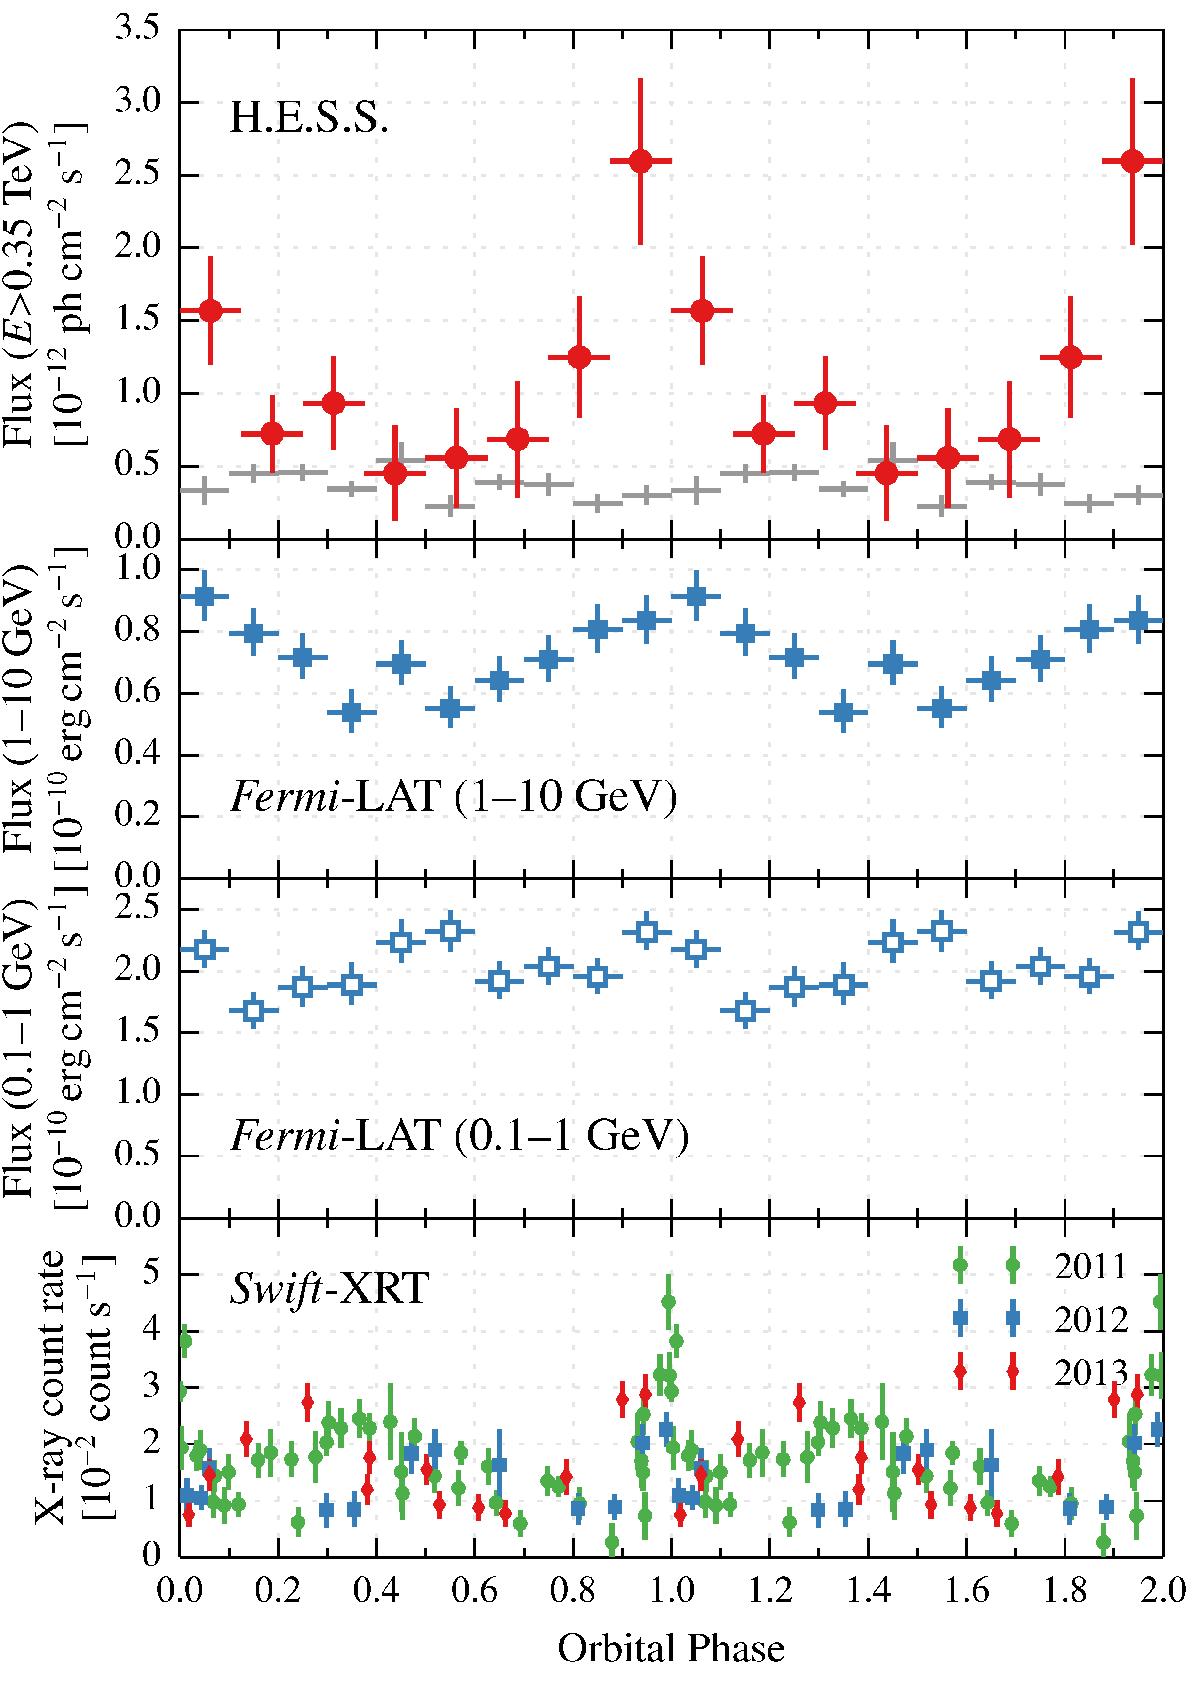
VHE, HE, and X-ray fluxes of 1FGL J1018.6–5856 folded with the orbital period of P = 16.58 d. Two orbits are shown for clarity. Top: VHE integral flux above 0.35 TeV measure by HESS (red circles). For comparison, a scaled light curve from the nearby bright source HESS J1023-589 is shown in grey. Middle top and middle bottom: Fermi-LAT light curve between 1 and 10 GeV (solid blue squares) and between 0.1 and 1 GeV (open blue squares; Ackermann et al. 2012). Bottom: X-ray 0.3–10 keV count-rate light curve from 67 Swift-XRT observations in 2011 (green), 2012 (blue), and 2013 (red).
Current usage metrics show cumulative count of Article Views (full-text article views including HTML views, PDF and ePub downloads, according to the available data) and Abstracts Views on Vision4Press platform.
Data correspond to usage on the plateform after 2015. The current usage metrics is available 48-96 hours after online publication and is updated daily on week days.
Initial download of the metrics may take a while.