Fig. 4
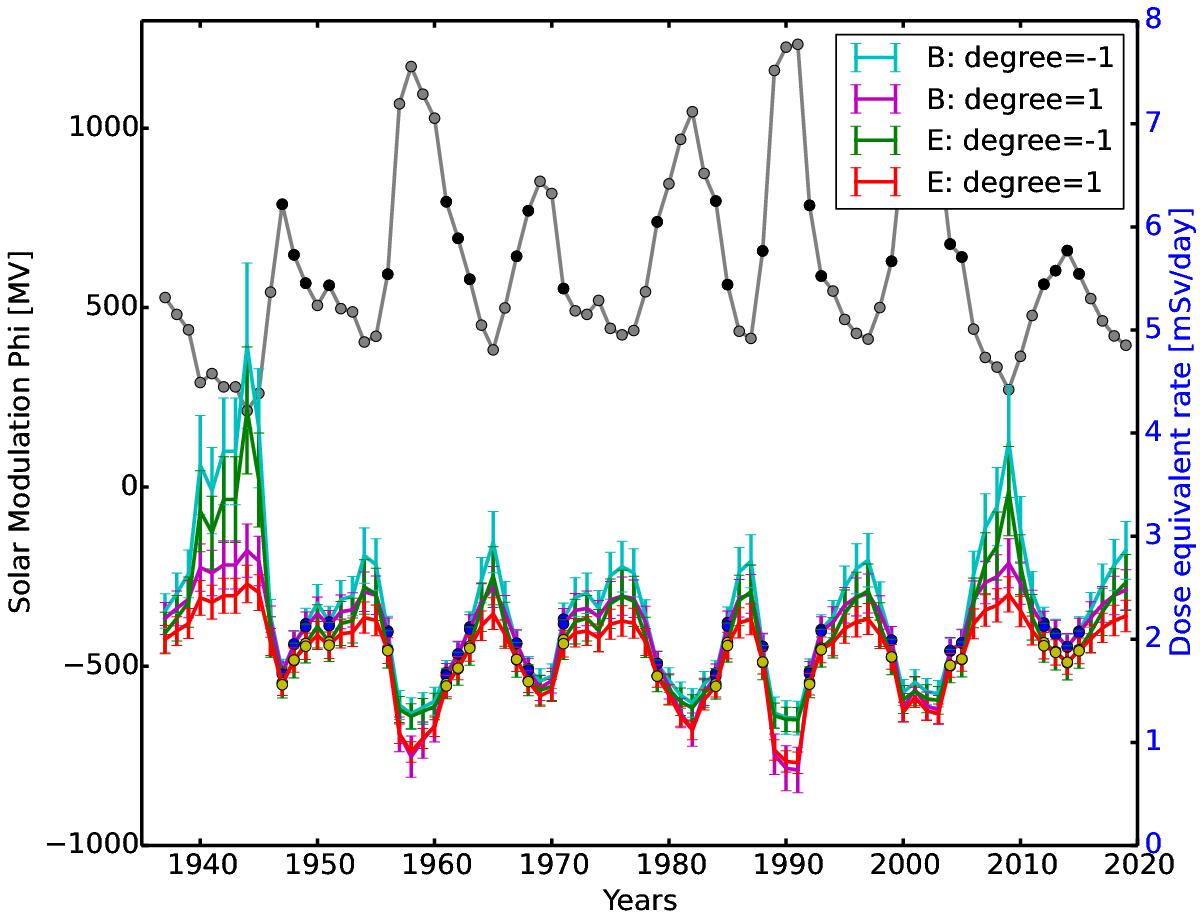
Annual average of reconstructed modulation potential Φ since 1937 (gray line and dots with units on the left axis) and estimated annual dose equivalent rate derived from different models (with units on the right axis). Cyan/green line shows the dose equivalent values derived from the nonlinear model (Eq. (3)) based on detector B/E measurements. Magenta/red line represents the dose equivalent values derived from the linear model (Eq. (2)) based on detector B/E measurements. Black, yellow, and blue dots represent the data within the range of modulation Φ between 550 and 810 MV which the RAD cruise measurements covered.
Current usage metrics show cumulative count of Article Views (full-text article views including HTML views, PDF and ePub downloads, according to the available data) and Abstracts Views on Vision4Press platform.
Data correspond to usage on the plateform after 2015. The current usage metrics is available 48-96 hours after online publication and is updated daily on week days.
Initial download of the metrics may take a while.