Fig. 3
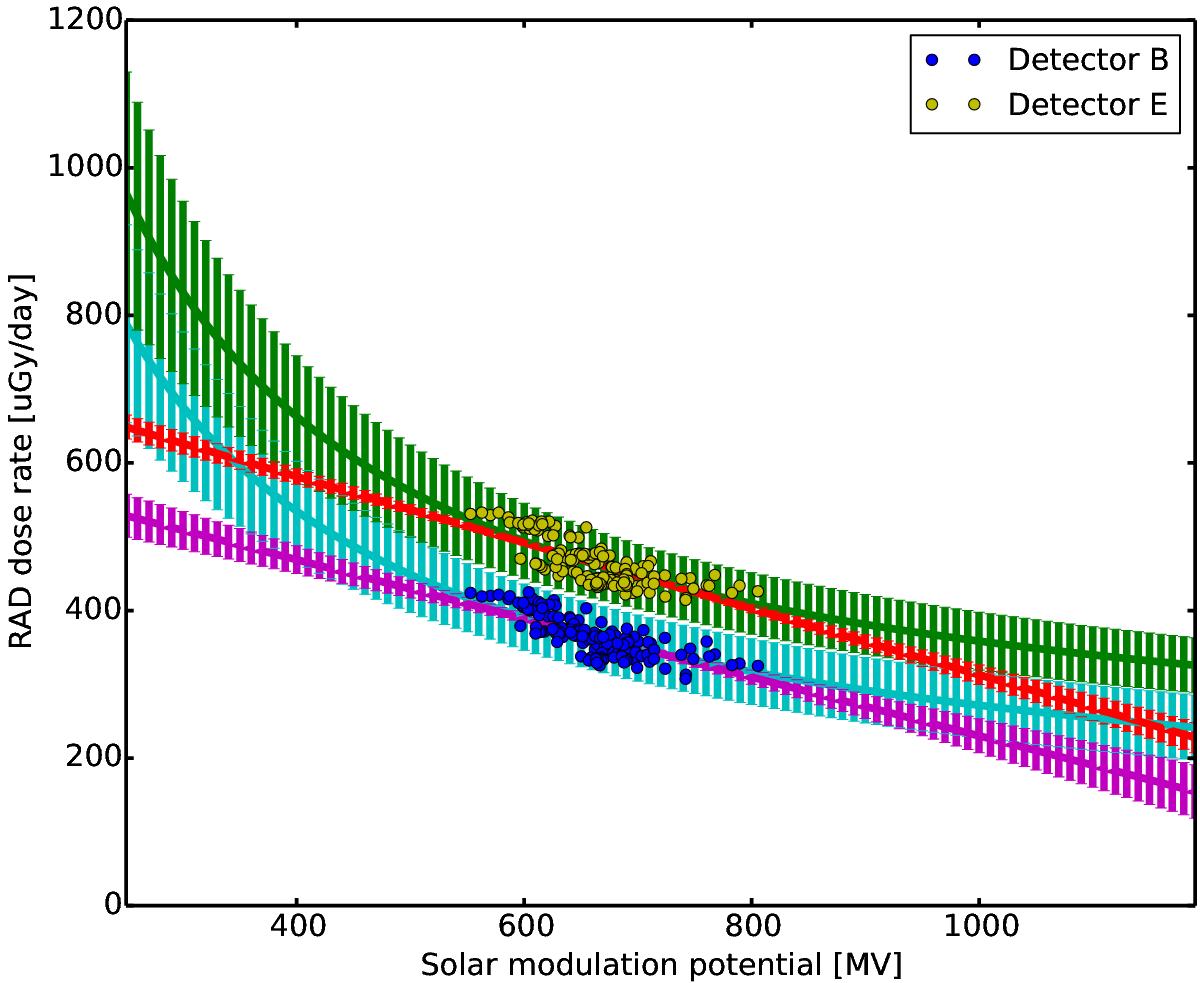
Data and fittings processed through bootstrap Monte Carlo simulations of the variations of the RAD dose rate and the solar modulation Φ during the cruise to Mars. The red/magenta lines represent the linear fits (Eq. (2) of RAD measured dose rate in detector E/B versus solar modulation potential. The green/cyan lines show the results of the nonlinear fits (Eq. (3)).
Current usage metrics show cumulative count of Article Views (full-text article views including HTML views, PDF and ePub downloads, according to the available data) and Abstracts Views on Vision4Press platform.
Data correspond to usage on the plateform after 2015. The current usage metrics is available 48-96 hours after online publication and is updated daily on week days.
Initial download of the metrics may take a while.