Fig. 2
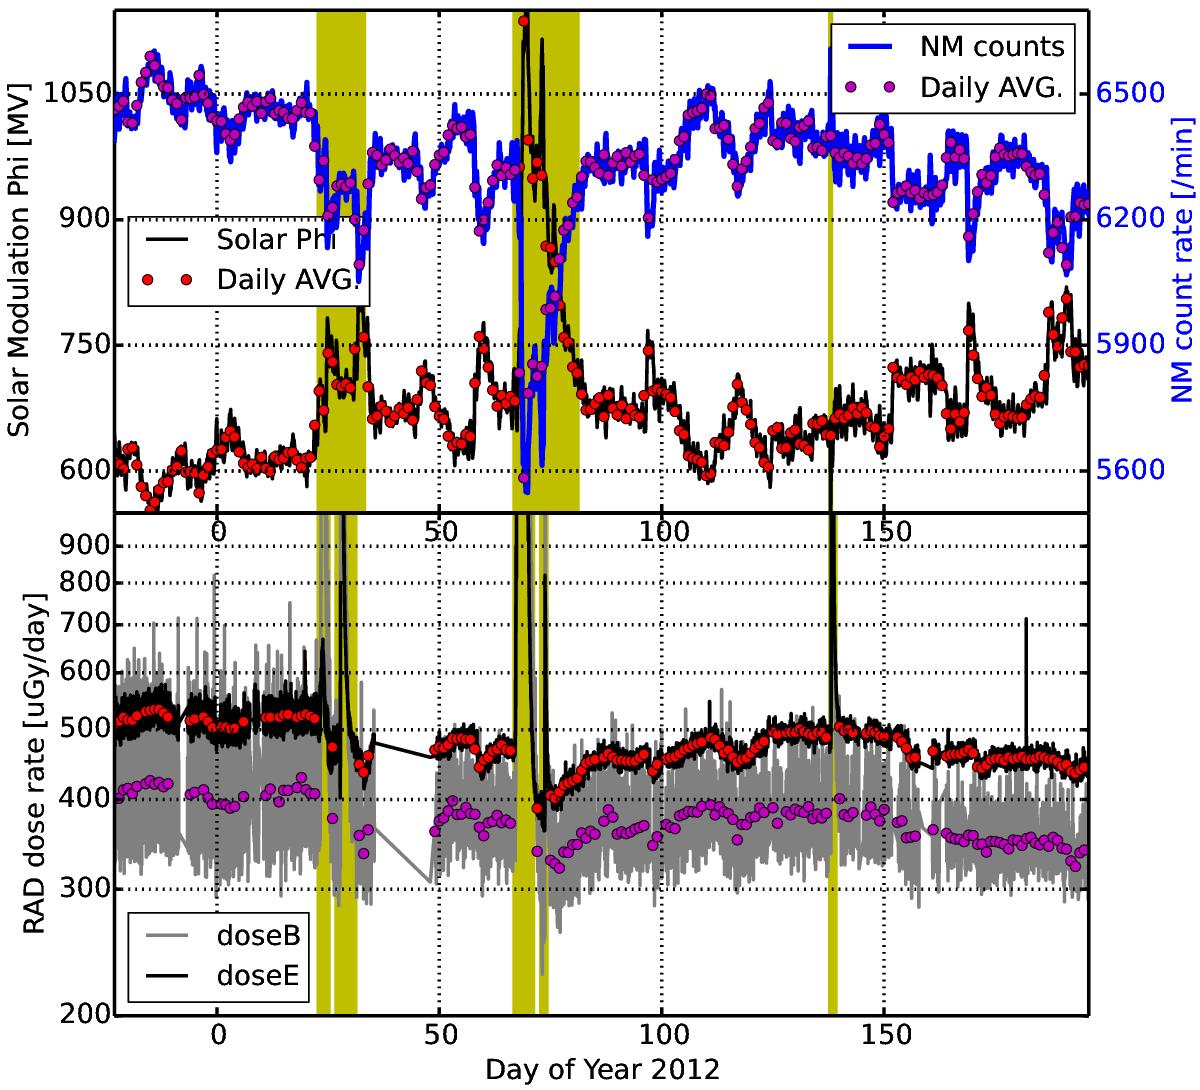
Top: Oulu neutron monitor count rate recorded during the time of MSL’s cruise to Mars (blue line) and daily averaged values (magenta dots). The black line shows the solar modulation potential Φ derived from the neutron monitor count rates and its daily average is shown as red dots. The RAD observed SEPs are highlighted in yellow shaded areas in which the data are not considered in the correlation study. Bottom: dose rate recorded by RAD in silicon detector B (gray curve) and in plastic scintillator E (tissue-equivalent, black curve). Their daily averaged values are plotted as solid dots in magenta and red.
Current usage metrics show cumulative count of Article Views (full-text article views including HTML views, PDF and ePub downloads, according to the available data) and Abstracts Views on Vision4Press platform.
Data correspond to usage on the plateform after 2015. The current usage metrics is available 48-96 hours after online publication and is updated daily on week days.
Initial download of the metrics may take a while.