Fig. 1
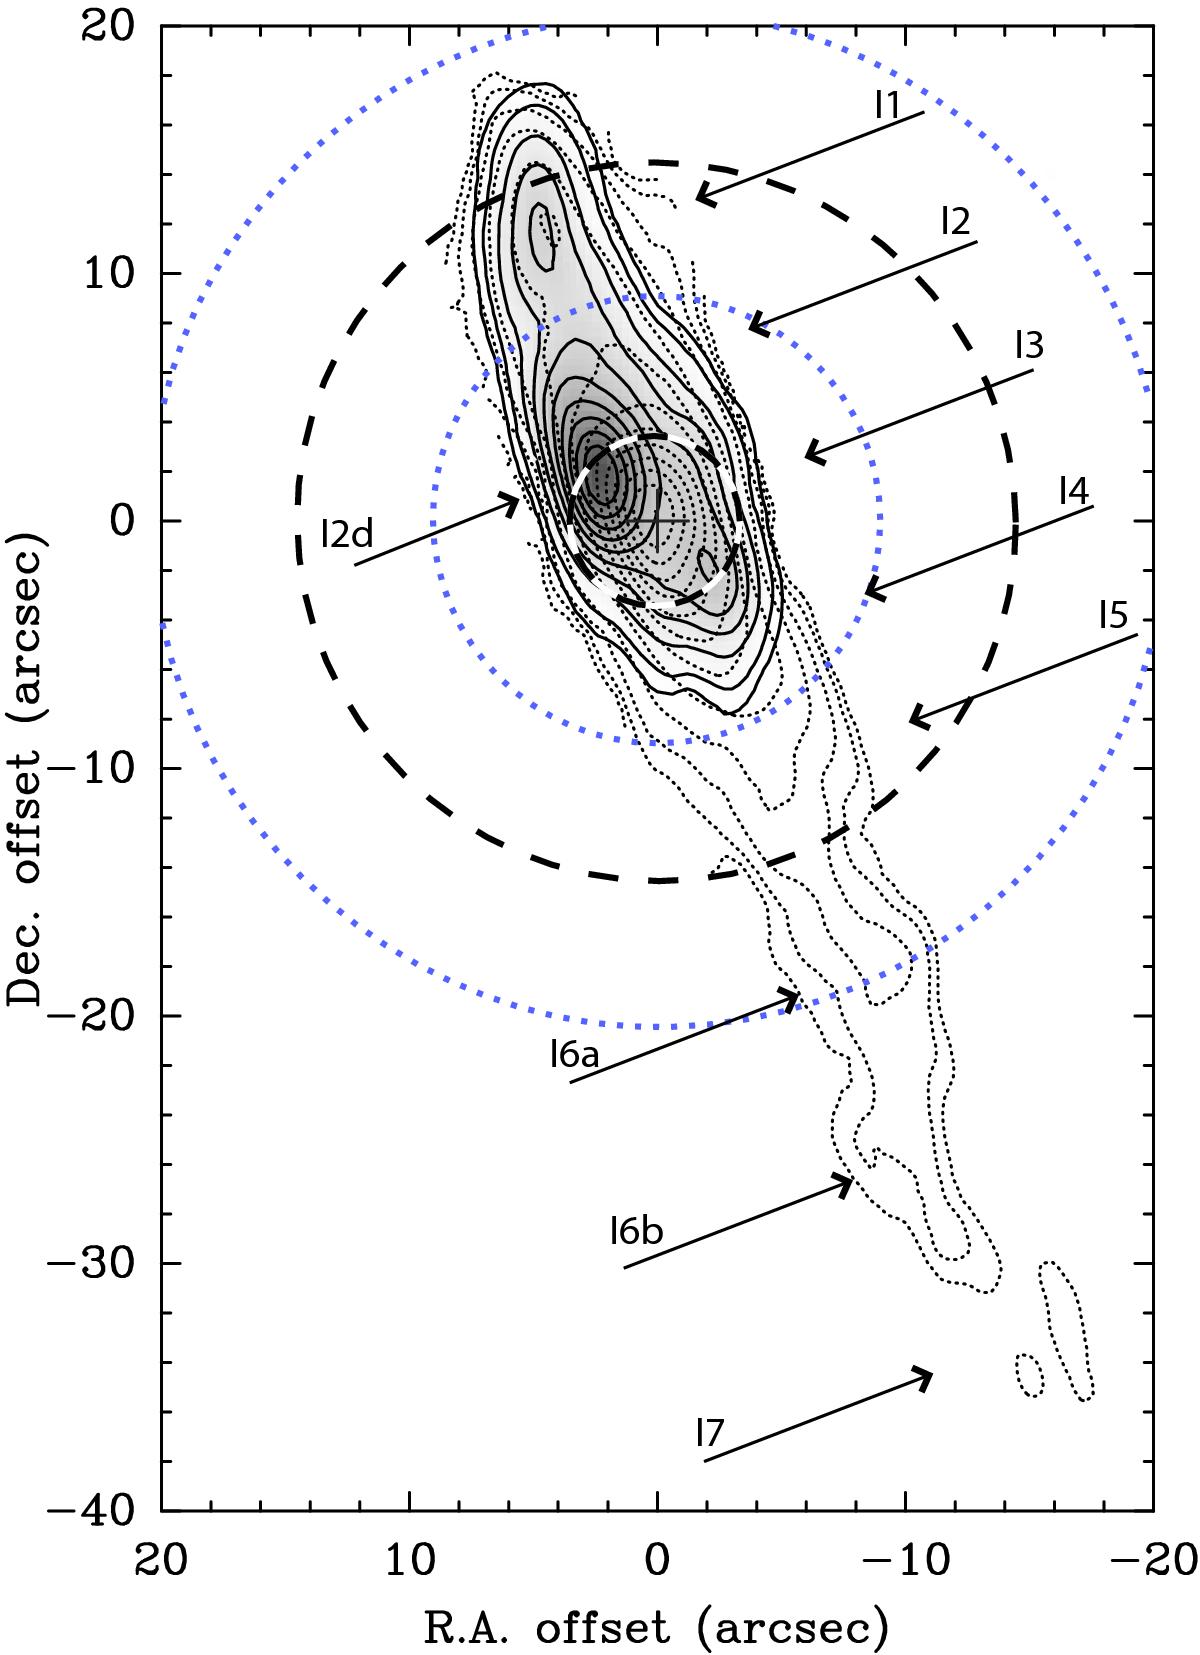
Distribution of the HCO+ (1–0) (gray scale and solid contours) and 12CO (1–0) (dotted contours) velocity-integrated emission in OH 231.8 from previous interferometric observations; adapted from Fig. 2 of Sánchez Contreras et al. (2000). The smallest and largest HPBW of the IRAM 30 m (long dashed) and Herschel (dotted) telescopes in these observations are represented by the circumferences. We labeled the different regions/clumps in the molecular outflow as I1 to I7, as in Alcolea et al. (2001). Clump I2d corresponds to the region where the HCO+ emission peaks. The VLSR range (in km s-1) of each clump is I1) [−80:−30], I2) [−30:+10], I2d) [−20:+60], I3) [+10:+55], I4) [+55:+80], I5) [+80:+150], I6a) [+150:+205], I6b) [+205:+230], and I7) [+230:+285]; see Table 2 in Alcolea et al. (2001), and also Sánchez Contreras et al. (1997, 2000), for more detail on the physical properties of the clumps.
Current usage metrics show cumulative count of Article Views (full-text article views including HTML views, PDF and ePub downloads, according to the available data) and Abstracts Views on Vision4Press platform.
Data correspond to usage on the plateform after 2015. The current usage metrics is available 48-96 hours after online publication and is updated daily on week days.
Initial download of the metrics may take a while.